His attention to detail and critical thinking skills are particularly impressive, and he consistently produced high-quality work. He is a team player who works well with others, often going above and beyond. I do not doubt that Alireza will excel in any future endeavors, and I highly recommend him as a valuable asset to any organization in the field of social media data mining.

Welcome to my portfolio! I’m a full-stack data professional with a passion for machine learning, predictive analytics, and process improvement. My goal is to harness the power of data to reveal untapped possibilities, bolster informed decision-making, and reshape the frameworks that guide our personal and professional lives.
Education:
In 2022, I earned my Master’s degree in Engineering Management (Data Science) with an A-grade point average from Syracuse University. My academic journey encompassed a diverse range of pertinent courses such as Data Science, Machine Learning, Social Media Data Mining, Simulation and Data Analytics, Business Analytics, Lean Six Sigma, and Database Management Systems.
My thesis delved into the realm of Industry 4.0, where I explored a simulated manufacturing environment to gather data and perform analyses. The crux of my research centered on evaluating the efficacy of a reinforcement learning agent designed to combat cyber-attacks, offering valuable insights into its potential applications within the manufacturing sector.
In 2015, I obtained my Bachelor’s degree in Engineering from Azad University, achieving an A grade on my thesis. My academic experience encompassed a wide array of subjects, including computer programming, engineering design, robotics, probability and statistics for engineers, engineering economics and technology valuation, and project management.
My thesis involved conducting comprehensive experiments to identify components for an optimized aeration system. By collecting and analyzing data from these experiments, I pinpointed key factors influencing aeration rates. To enhance existing methodologies, I designed a perforated stepped nozzle that resulted in a 15% improvement in aeration rates compared to the current state-of-the-art technology.
Experience:
Komar Industries; Since 2023; Responsibilities:
- Collaborated with various departments, understanding their data needs and delivering tailored solutions that met their specific requirements.
- Integrated over eight ERP systems into a centralized data warehouse on AWS, leveraging Amazon Redshift and S3, and optimizing data retrieval with complex SQL queries.
- Designed and optimized ETL pipelines, implementing data transformation, cleansing, and validation using Python to ensure high data quality and compliance with industry regulations.
- Automated data processing workflows using Python scripts, reducing manual effort and improving efficiency in data ingestion, transformation, and reporting.
- Developed interactive dashboards and reports using Power BI/Tableau, providing actionable insights that drive strategic business decisions.
- Collaborated with cross-functional teams to define data requirements, create predictive models, and deliver insights that influenced pricing strategies and revenue optimization.
Shupper-Brickle; 2023-2023; Responsibilities:
- Collaborated with various departments, understanding their data needs and delivering tailored solutions that met their specific requirements.
- Investigated and resolved data discrepancies, implementing new procedures to prevent future errors, enhancing overall data integrity.
- Conducted comprehensive customer profitability and cost analysis, providing actionable insights to management through KPIs, customized dashboards, and visualizations.
- Revitalized a failing 20-year, $12 million project through cutting-edge research and implementation of innovative solutions such as point cloud collection, VR data techniques, and advanced processing and visualization.
- Achieved a 46% cost reduction by designing a Python-based system for ERP and UPS APIs integration, enhancing data quality and efficiency.
- Spearheaded projects that enhanced search functionality in the ERP system by implementing new data accuracy protocols.
- Developed and delivered training programs, incorporating automation to boost operational efficiency.
Syracuse University; 2021-2022; Responsibilities:
As a Graduate Teaching Assistant in the Department of Mathematics at Syracuse University:
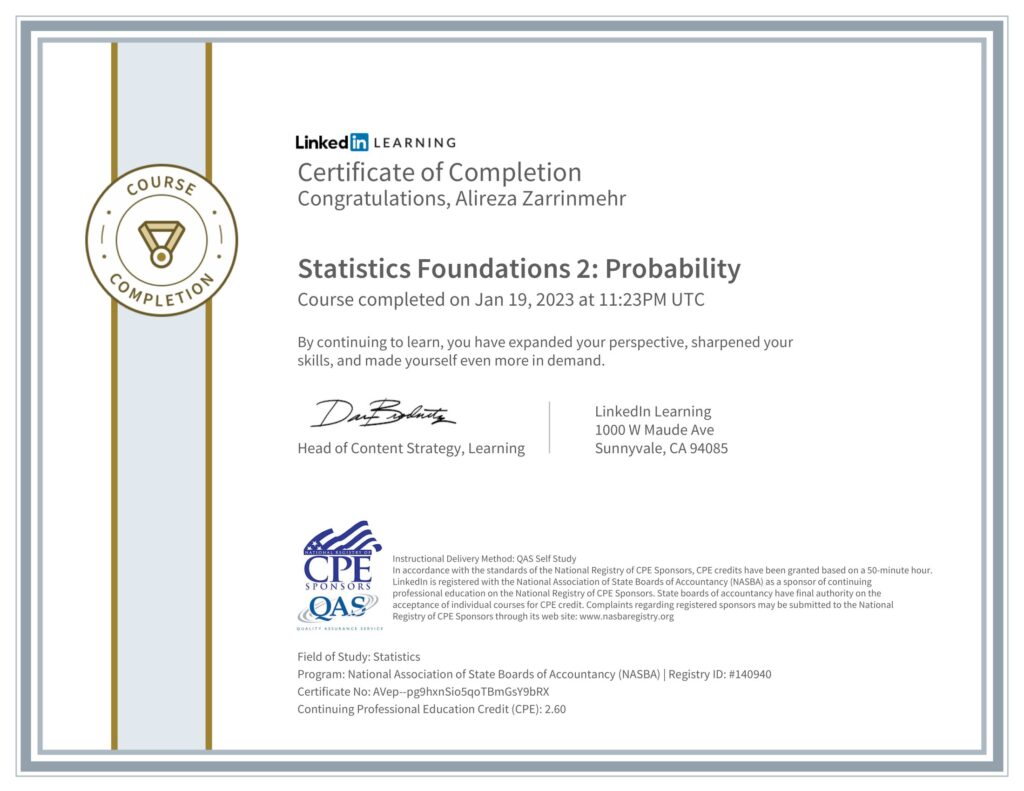
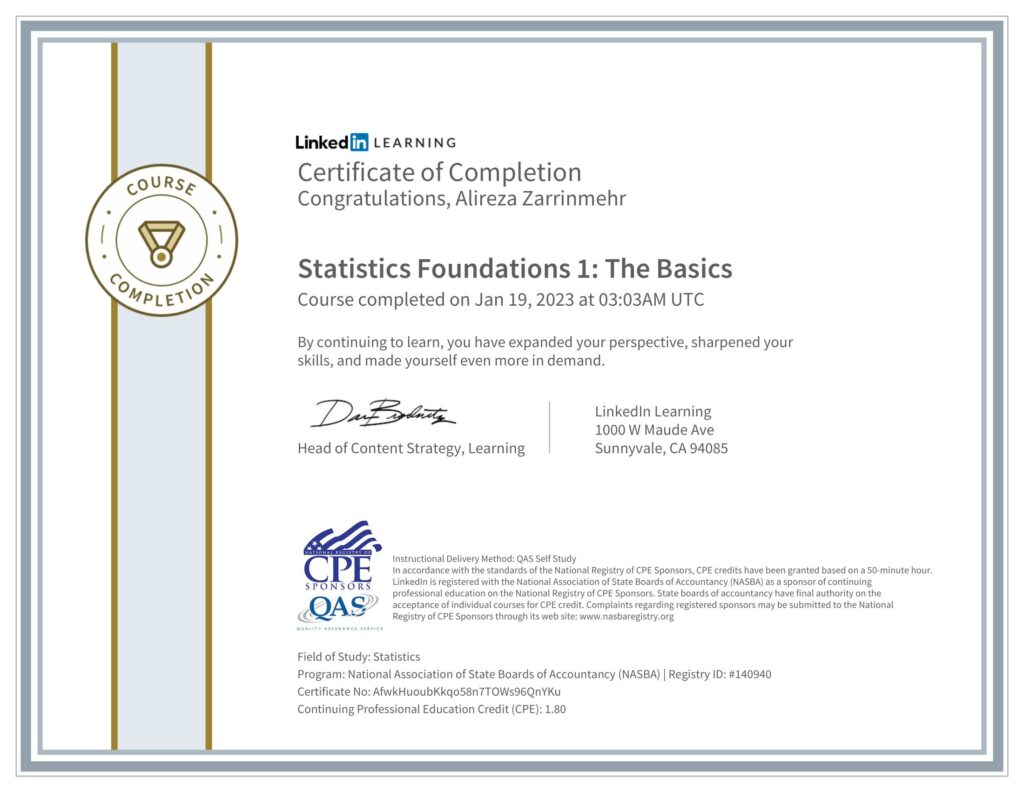
- I conducted instruction sessions emphasizing real-world applications of statistical concepts such as probabilities, probability distributions, hypothesis testing, inferential statistics, confidence intervals, two-sample inference, regression analysis, ANOVA, non-parametric tests, and statistical process control, with clear instructions and practical examples using Minitab software
- With a top median feedback score of 5/5 from students, I demonstrated competence in effectively and accurately elucidating complex concepts, showcased readiness to provide supportive assistance with patience when responding to inquiries, and exhibited proficiency in delivering concise summaries of information coupled with efficient time management.
As a Graduate Research Assistant in the School of Engineering and Computer Science:
- I initiated and executed the design of a cyber-manufacturing testbed. This involved integrating a suite of advanced sensors, ensuring consistent and uninterrupted data parameters. Through diligent data aggregation, cleaning, and structuring, we unearthed key insights into potential system vulnerabilities.
- I implemented a multi-layered attack-recovery algorithm with an adaptive recovery agent. This agent was specifically designed to predict and counteract threats based on historical patterns. Rigorous data processing and analysis confirmed the algorithm’s efficacy, enhancing the security and resilience of the systems against cyber threats.
Zarrin Mehr Cranes; 2015-2020; Responsibilities:
- Developed a data-driven strategic plan that identified potential growth areas, contributing to an increase in company revenues.
- Leveraged data analysis to optimize pricing strategy, leading to a 20% increase in net profit.
Streamlined the financial data analysis process, which improved forecast accuracy and drove better budgeting decisions. - Conducted market trend analysis to anticipate economic downturns, enabling proactive pricing adjustments and revenue protection.
- Identified potential high-growth markets using data analytics, which supported a successful expansion strategy.
- Developed a predictive model that anticipated market trends, giving the company a competitive edge in its industry.
- Created a comprehensive risk assessment model that predicted potential business threats, thereby improving the company’s risk mitigation strategy.
- Implemented a digital transformation project that modernized the company’s data infrastructure, reducing downtime.
- Automated repetitive data processes, increasing operational efficiency by 26%.
- Created and led training programs for junior analysts, thereby boosting team productivity.
- Regularly communicated data insights with stakeholders, thereby improving transparency and strengthening relations.
- Developed a data-driven employee satisfaction model that contributed to improving the workplace culture and reducing turnover.
- Identified data patterns suggesting greener operations, leading to a reduction in the company’s carbon footprint.
- Created a data model to track the company’s environmental impact, further supporting corporate sustainability goals.
Projects:
The project focuses on conducting an in-depth analysis of weekly sales driven by various media channels and organic search metrics. In a data-driven marketing landscape, understanding how each channel contributes to sales is crucial for optimizing ROI. The analysis works with a weekly dataset incorporating multiple variables like TV GRPs, radio, newspaper, search clicks, and organic search topics…
This project focuses on leveraging the capabilities of Google Cloud SQL and Google Colab to manage, analyze, and visualize data stored in an SQL Server instance. It covers a wide array of functionalities that not only involve basic table creation and data insertion but also extend to advanced queries, data manipulation, procedural automation…
The goal of this project is to meticulously analyze and understand the global trends and patterns in the field of artificial intelligence (AI), an area that is increasingly…
This is a comprehensive statistical analysis focused on the historical medical records of childbed fever mortality rates at Vienna General Hospital during the 1840s…
In this comprehensive data analysis project, I aimed to understand the impact of the COVID-19 pandemic on a company’s operations and prepare the company for similar future scenarios. Here’s a detailed look at the process…
In a bid to enhance the sales performance of Pens and Printers, I embarked on a detailed analysis of their sales strategies, which included email, call, and a blend of email and call. My primary aim was to figure out which method maximized customer engagement and yielded the highest revenue…
In this initiative, my objective was to construct a machine learning model capable of discerning sentiments from sentences plucked from the Rotten Tomatoes movie reviews dataset. The core aim was to decode and grasp the emotions encapsulated in these sentences, and then sort them into distinctive sentiment categories…
In this project, I analyze the Nobel Prize, one of the most prestigious scientific awards worldwide, by exploring data on its recipients from 1901 to 2016. I start by loading the Nobel Prize dataset into a Pandas DataFrame and take a preliminary look at the initial laureates…
The project focuses on conducting a comprehensive analysis of the Android app market, which is a rapidly growing industry that has revolutionized the way people interact with technology. With mobile apps becoming ubiquitous and easy to create, it is essential to analyze the market to gain insights that can help to drive growth and retention…
The project detailed herein is an analytical endeavor I undertook, utilizing a dataset provided by BusinessFinancing.co.uk. The goal was to explore and identify the oldest operational businesses in almost every country worldwide. The study was guided by my intent to better understand the characteristics that have allowed such businesses to endure the test of time…
To predict people who would spend more on healthcare in the upcoming year, we followed these steps:
- Data collection: We collected data on healthcare expenses, patient demographics, medical history, diagnosis, and treatment plans from various sources such as electronic health records, claims data, and clinical notes.
- Data cleaning and preprocessing: We cleaned and preprocessed the data to remove any duplicates, missing values, or inconsistencies.
- Feature engineering: We extracted and created new features from the data that can be used to predict healthcare expenses. Some of the features that we extracted from the data included patient age, gender, medical history, diagnosis, treatment plan, and healthcare provider.
- Model selection: We chose a machine learning model that could be used to predict healthcare expenses. Some of the popular machine learning models for expense prediction in healthcare include linear regression, decision trees, and random forests.
- Model training: We trained the machine learning model on the preprocessed data and features.
- Model evaluation: We evaluated the performance of the model using various metrics such as mean squared error (MSE), root mean squared error (RMSE), and R-squared.
- Feature importance analysis: We analyzed the importance of each feature in the model to identify which features had the most significant impact on healthcare expenses.
- Prediction and analysis: We used the trained model to predict which patients would spend more on healthcare in the upcoming year. We analyzed the results to identify specific factors that contributed to higher healthcare expenses, such as chronic conditions or hospitalizations.
- Actionable insights and recommendations: We provided actionable insights and recommendations to healthcare providers and payers on how to lower healthcare costs for high-risk patients. For example, recommendations could include providing preventative care to manage chronic conditions, reducing unnecessary hospitalizations, or improving patient education to promote healthy lifestyles.
By following these steps, we developed a state-of-the-art model for predicting healthcare expenses and provided specific recommendations to lower healthcare costs. The key to achieving state-of-the-art performance was to use advanced machine learning techniques and to continuously update and refine the model with new data.
The Scala programming language has a repository of real-world project data with over 30,000 commits and a history of over ten years. As a mature, general-purpose language, Scala has gained popularity among data scientists in recent years.
One advantage of Scala is that it is an open source project, meaning that its entire development history is publicly available, including information on who made changes, what changes were made, and code reviews.
In this project, we will explore and analyze the Scala project repository data, which includes data from both Git (version control system) and GitHub (project hosting site). Through data cleaning and visualization, we aim to identify the most influential contributors to the development of Scala and uncover the experts in this field.
This project focuses on exploring and analyzing a dataset of episodes from the American version of the popular TV show “The Office”. The project aims to understand how the popularity and quality of the series varied over time by examining different characteristics of each episode, including ratings, viewership, guest stars, and more.
The dataset used in this project, which was downloaded from Kaggle, contains information on 201 episodes over nine seasons. The information provided for each episode includes its canonical episode number, the season in which it appeared, its title and description, the average IMDB rating, the number of votes, the number of US viewers in millions, the duration in minutes, the airdate, the guest stars in the episode (if any), the director of the episode, the writers of the episode, a True/False column for whether the episode contained guest stars, and the ratings scaled from 0 (worst-reviewed) to 1 (best-reviewed).
By analyzing this dataset, we can gain insights into how different factors impacted the popularity and quality of the show. For example, we may discover that episodes with guest stars tended to have higher viewership or ratings, or that certain directors or writers were associated with particularly successful or popular episodes. Overall, this project provides an interesting and in-depth analysis of one of the most popular and beloved TV shows of all time.
The problem was defined: The first step was to identify the problem to be solved, such as predicting stock prices based on social media sentiment analysis.
Data was collected and processed: Once the problem was defined, the relevant data was collected and processed. In this case, data was collected from Twitter using data mining techniques such as web scraping or API calls.
Data was cleaned and preprocessed: After collecting the data, it was cleaned and preprocessed to remove noise, irrelevant information, and duplicates. Text preprocessing was also performed, such as tokenization, stemming, and stop-word removal.
Sentiment analysis was performed: Sentiment analysis was performed on the preprocessed Twitter data to extract sentiment information, such as positive, negative, or neutral sentiment. This was done using techniques such as Naive Bayes, Support Vector Machines (SVM), or Recurrent Neural Networks (RNNs).
Correlation between sentiment and stock prices was analyzed: Once sentiment analysis was performed, the correlation between sentiment and stock prices was analyzed. This was done using statistical techniques such as regression analysis or machine learning algorithms such as Random Forest, Decision Trees, or Gradient Boosting.
The model was validated: After analyzing the correlation, the model was validated to ensure its accuracy and reliability. This was done using techniques such as cross-validation or holdout validation.
The model was deployed: Finally, the model was deployed to predict stock prices based on Twitter sentiment analysis. This was done using various deployment options, such as cloud services or on-premise deployment.
Twitter data mining and stock market prediction projects involve a combination of data mining, natural language processing (NLP), sentiment analysis, and machine learning techniques to extract valuable insights from social media data and predict stock prices.
We scraped and stored web data and implemented machine learning algorithms to predict the outcome of NBA games, achieving state-of-the-art performance. Here are the steps we followed:
- Data collection: We collected data on NBA games, including team statistics, player statistics, game schedules, and game results, from various sources such as NBA.com, ESPN, or Basketball-Reference.com.
- Data cleaning and preprocessing: We cleaned and preprocessed the data to remove any duplicates, missing values, or inconsistencies.
- Feature engineering: We extracted and created new features from the data that can be used to predict the outcome of NBA games. Some of the features that we extracted from the data included team win-loss records, player stats, team performance in specific game situations, and home court advantage.
- Model selection: We chose a machine learning model that could be used to predict the outcome of NBA games. Some of the popular machine learning models for game prediction include SVM, logistic regression, decision trees, and neural networks.
- Model training: We trained the machine learning model on the preprocessed data and features.
- Model evaluation: We evaluated the performance of the model using various metrics such as accuracy, precision, recall, and F1 score.
- Feature importance analysis: We analyzed the importance of each feature in the model to identify which features had the most significant impact on the outcome of NBA games.
- Prediction and analysis: We used the trained model to predict the outcome of NBA games. We analyzed the results to identify specific factors that contributed to winning or losing, such as team chemistry, player injuries, or coaching strategy.
- Playoff prediction: Based on the regular season results and the model predictions, we predicted which teams would make the playoffs and how far they would go in the playoffs.
By following these steps, we were able to scrape and store web data and implement machine learning algorithms to predict the outcome of NBA games, achieving state-of-the-art performance. To achieve state-of-the-art performance, we used advanced machine learning techniques, such as deep learning, and continuously updated and refined the model with new data.
As a team, we analyzed historical data on airport processes such as passenger arrivals, check-in times, security check times, boarding times, flight schedules, and other relevant information. Based on this data, we simulated the airport processes using software tools like Arena, Simul8, or AnyLogic. Using the simulation models, we proposed an optimized airport layout that minimized the operation cost and passenger waiting time.
We defined our optimization objectives, which included minimizing passenger waiting times, reducing flight delays, and minimizing operational costs. We applied optimization techniques such as response surface methodology, Taguchi methods, and DOE to identify the most significant factors affecting the airport processes and their optimal levels.
We analyzed and optimized the airport layout, passenger flows, and resource allocation to minimize passenger waiting times, reduce flight delays, and minimize operational costs. To validate our results, we compared the optimization models’ predictions with real-world data and assessed the impact of the proposed changes.
Finally, we implemented the proposed changes in the airport operations, layout, and resource allocation to improve the airport processes’ efficiency and achieve the optimization objectives. Overall, our work as a team helped improve airport efficiency and passenger experience by proposing an optimized airport layout that minimized operation costs and passenger waiting time.
Defined the problem and goals: The first step was to identify the problem and set specific goals for improvement. In this case, the goal was to increase the RGA first pass yield (FPY) by 30%.
Collected and analyzed data: Data related to the manufacturing process was collected and analyzed. This included data on equipment, materials, personnel, and other variables that could impact the yield.
Performed root cause analysis: Statistical tools and techniques such as Pareto analysis, Ishikawa diagrams, and statistical process control (SPC) were used to identify the root causes of the problem. These techniques helped identify the factors that contributed to low yield and prioritize them based on their impact.
Brainstormed potential solutions: Based on the root cause analysis, potential solutions to improve the process were brainstormed. This could involve changes to equipment, materials, personnel, or the manufacturing process itself.
Reduced variability: Changes were implemented to reduce variability in the manufacturing process. This could involve improving equipment maintenance, standardizing processes, or increasing the accuracy of measurements.
Controlled the process: Control plans and procedures were developed to ensure the process was maintained at an optimal level over time. This involved monitoring key process parameters and implementing corrective actions when necessary.
Measured success: The success of the process improvements was measured using metrics such as RGA first pass yield (FPY) and other key performance indicators. These metrics were tracked over time to ensure the improvements were sustained.
Overall, the goal of the project was to identify and implement changes to the semiconductor manufacturing process that improved the RGA first pass yield (FPY) by 30%. The project involved a systematic approach to problem-solving that included data collection and analysis, root cause analysis, brainstorming potential solutions, reducing variability, controlling the process, and measuring success over time
In the Database Design for Airlines project, I designed a database that could manage all aspects of an airline’s operations. To accomplish this, I developed data models that captured relevant data entities and their relationships and defined attributes and constraints for each entity.
As part of the database design, I ensured that the system could track flight information, such as departure and arrival times, flight numbers, and aircraft types. I also included capabilities to store customer and employee information, such as personal details, contact information, and login credentials.
Moreover, the database managed information about the airline’s fleet, such as aircraft types, seating arrangements, maintenance schedules, and availability. It also tracked ticket sales, reservations, cancellations, and refunds, along with payment details and other financial transactions.
To ensure the database design met the airline’s business requirements, I applied various constraints, including data validation rules, referential integrity, and security measures. My ultimate goal was to create an efficient, reliable, and scalable database system that could seamlessly support the airline’s operations.
Extracted historical procurement, design, manufacturing, and sales data. Predicted costs and improved the accuracy and speed of the bidding process.
To improve the company’s production efficiency, I developed a data visualization application that collected data from sensors on the production line and combined it with information from the company’s ERP system to generate real-time insights and visualizations. The optimized data structure was designed to handle large volumes of data and support real-time analytics and reporting. This helped the company to identify patterns in the production process, analyze customer feedback, and generate reports on inventory levels, production costs, and sales performance.
In addition to developing the data visualization application, I also developed algorithms and models using machine learning techniques to analyze the data and identify patterns and trends. I ensured scalability, automation, and security of the application, which allowed managers to interact with the data and make informed decisions based on the insights and analytics provided.
To ensure data consistency and integrity, I integrated data from various sources and improved them to meet data quality and accessibility standards. I collaborated with stakeholders to understand business requirements and created functional and technical designs for the data visualization application. I also documented data visualization artifacts for future updates and changes.
Throughout the integration process, I encountered various data quality issues that required collaboration with data architects and IT professionals to address. Ultimately, my efforts led to the development of a new data visualization application that provided managers with real-time insights and visualizations to identify bottlenecks and areas for improvement, as well as alerts when issues arose.
Website design, content production, and search engine optimization (SEO) lead to a 10 percent increase of annual revenue.
The primary objective of this project is to design and optimize nozzles through experimental methods and subsequent data analysis. We aim to create a nozzle design that maximizes flow efficiency, reduces pressure losses, and can be effectively applied in various industrial or aerospace applications.
Methodology:
- Data Collection: To start, we collect data on existing nozzles under various conditions like flow rate, pressure, temperature, etc. This includes both qualitative observations and quantitative measurements. The methods of data collection could range from direct measurement to the use of sensors or imaging techniques.
- Experiment Design: We set up a series of experiments, manipulating variables such as nozzle shape, size, material, and operating conditions. The aim here is to understand the impact of these variables on the nozzle’s performance. The experimental design should be systematic and controlled, allowing us to draw meaningful conclusions from the results.
- Data Analysis: The collected data is then analyzed using statistical methods, computational fluid dynamics (CFD) simulations, or machine learning techniques to derive relationships between the variables and the nozzle’s performance. This step provides insights into how to improve nozzle design and operation.
- Prototype Design: Based on the analysis, we design and fabricate nozzle prototypes incorporating the optimal characteristics identified.
- Testing and Validation: The newly designed nozzles are then subjected to rigorous testing under different conditions to validate their performance. The data collected from these tests are again analyzed and compared with the initial data set to measure the level of improvement.
The project has provided a profound understanding of factors impacting nozzle performance, leading to an optimized design that increases efficiency. The result is a versatile nozzle that can enhance various applications, from vehicle fuel systems to rocket propellants. Through meticulous lab experiments and aeration data analysis, a circular nozzle was designed, improving fluid oxygen saturation by 15%, marking a significant milestone in fluid dynamics efficiency.
**Project Overview:**
I was involved in a significant data engineering project for a large e-commerce company. The company needed a robust infrastructure to analyze customer behavior in real-time to enhance user experience, offer tailored promotions, and refine their business strategy. I had to work with multiple data sources, including online transactions, clickstream data, customer reviews, social media interactions, and inventory details.
**Step 1: Requirement Gathering and Planning**
My first step was to comprehend the business objectives and the nature of the data sources. I also had to define the specific requirements, such as real-time analysis needs. Armed with this information, I planned the data pipeline architecture, including the technology stack, the data model, and the data transformation processes.
**Step 2: Data Ingestion**
Next, I focused on the data ingestion layer. This involved establishing connections with various data sources and extracting the data. This was challenging due to the different types of data systems, including databases, APIs, and logs. To handle this, I implemented Apache Kafka for real-time data ingestion.
**Step 3: Data Processing and Transformation**
Once the data was ingested, I proceeded with data cleaning and transformation processes to ensure data was in the right format and quality for analysis. This step involved removing duplicates, handling missing values, and transforming data into a specific structure. I used Apache Spark for this stage.
**Step 4: Data Storage and Management**
Upon cleaning and transforming the data, I loaded it into a centralized data warehouse. Here, all data was stored for subsequent analysis. For the storage system, I chose Google BigQuery based on its compatibility with our requirements.
**Step 5: Testing and Monitoring**
I thoroughly tested the pipeline to verify its functionality, data accuracy, performance, and reliability. Once deployed, I established a regular monitoring regimen using Apache Airflow to detect and troubleshoot any issues swiftly.
**Step 6: Documentation and Maintenance**
After the successful deployment of the pipeline, I documented the entire process and architecture, making it accessible for any future updates or maintenance. Given that customer behaviors and business requirements are ever-evolving, I ensured to routinely update and refine the pipeline to accommodate new data sources, modify the data transformation logic, or scale the pipeline to handle increased data.
In summary, this project was an excellent opportunity to apply my data engineering skills in a real-world setting, designing and implementing a comprehensive solution to meet a large e-commerce company’s complex data needs.
References:
Alireza is an excellent candidate for a Clements Award. He is very inquisitive and very motivated. He works hard, he works with passion.
Alireza has been a great addition to our team at Syracuse University in the Campus Planning, Design and Construction office. He has supported multiple projects and his oversight has been extremely valuable. He’s a great teammate and communicator. Lucky to have him!
Alireza is motivated and organized. His reports are thorough and well organized. He has expressed a desire to take on more challenging assignments. I am confident he has the skill set to handle more challenging work when the opportunity arises. Alireza’s written and verbal communication is excellent.
Alireza conducted his B.Sc. thesis under my direct supervision. During the time I have known him, Alireza demonstrated comprehensive understanding of mechanical concepts. It is worth mentioning that he passed his thesis with excellent grade A. The quality of his research work was outstanding!
Alireza has demonstrated a positive attitude during the entire time that he has worked. He has shown himself to be very bright, quite motivated, a quick learner and has shown great ability in collaboration conflict management, problem solving, and time management.
I am very pleased with Alireza’s work and effort and impressed.
Alireza did an absolutely terrific job in the most professional manner and was great help to me in my projects.
Alireza has gone above and beyond! He rose through our ranks of employment promoting twice within his first three months of employment. His consistent performance, and willingness to do projects, makes him a great leader. I’ve witnessed Alireza’s ability to stay calm in stressful situations, showcasing his professionalism, maturity, and positive attitude.
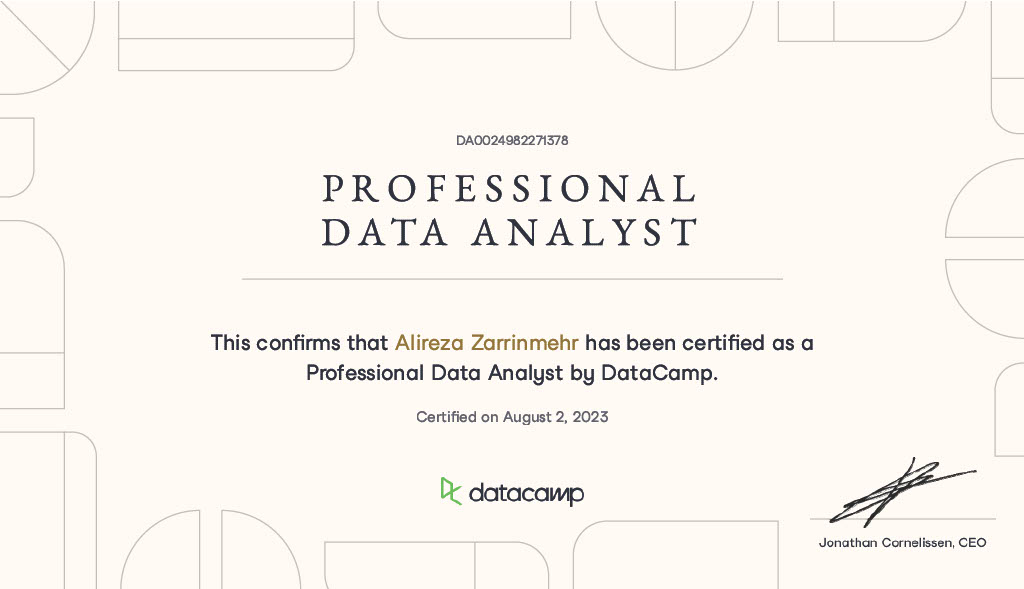
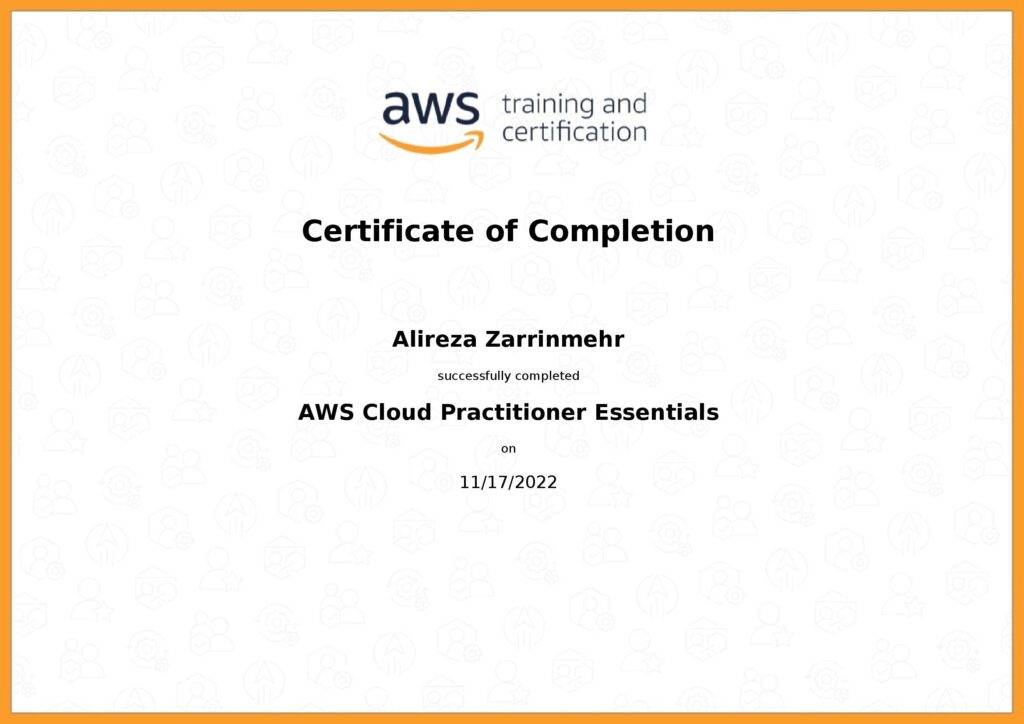
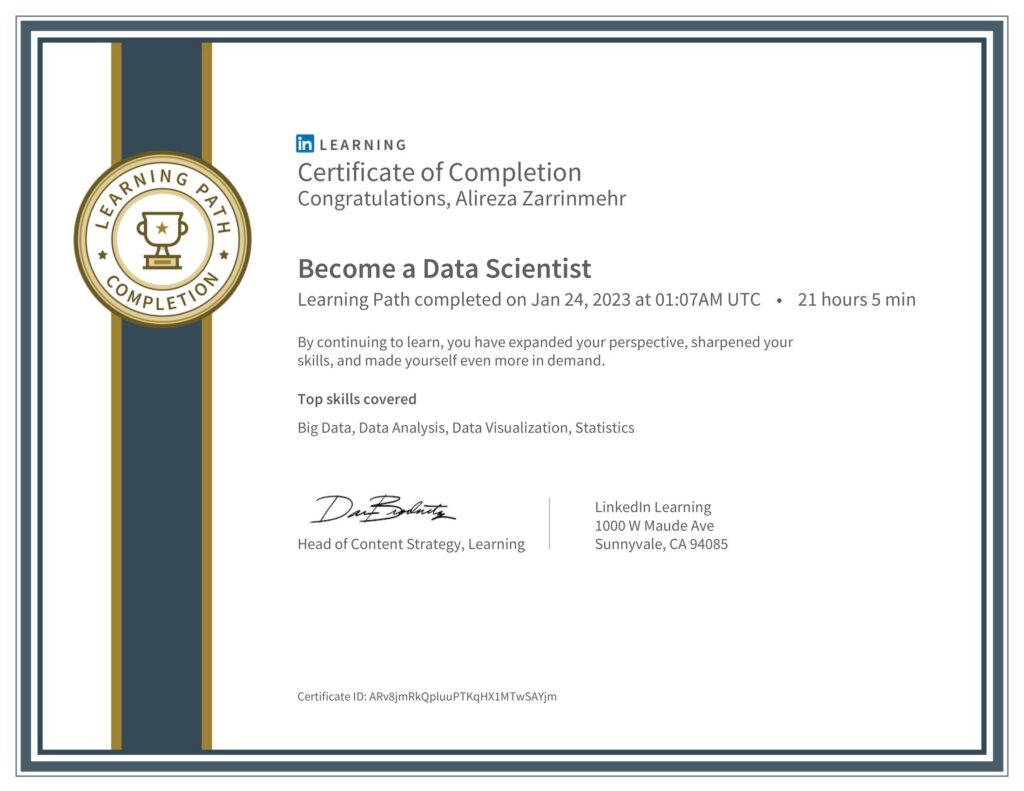
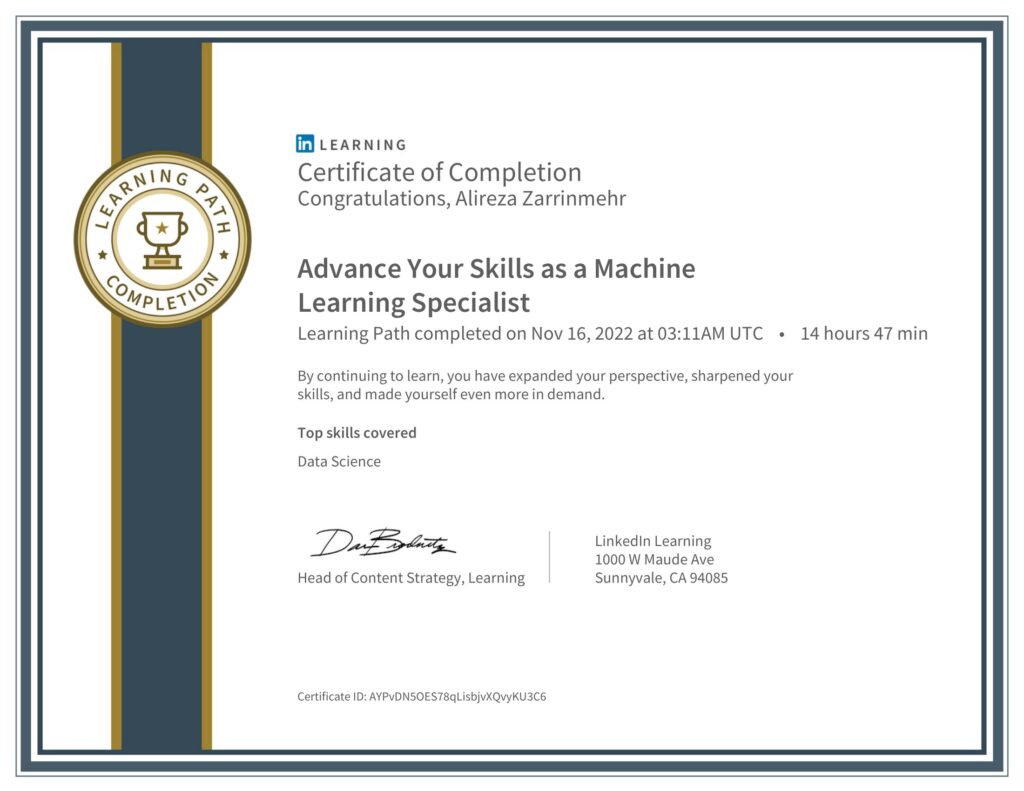
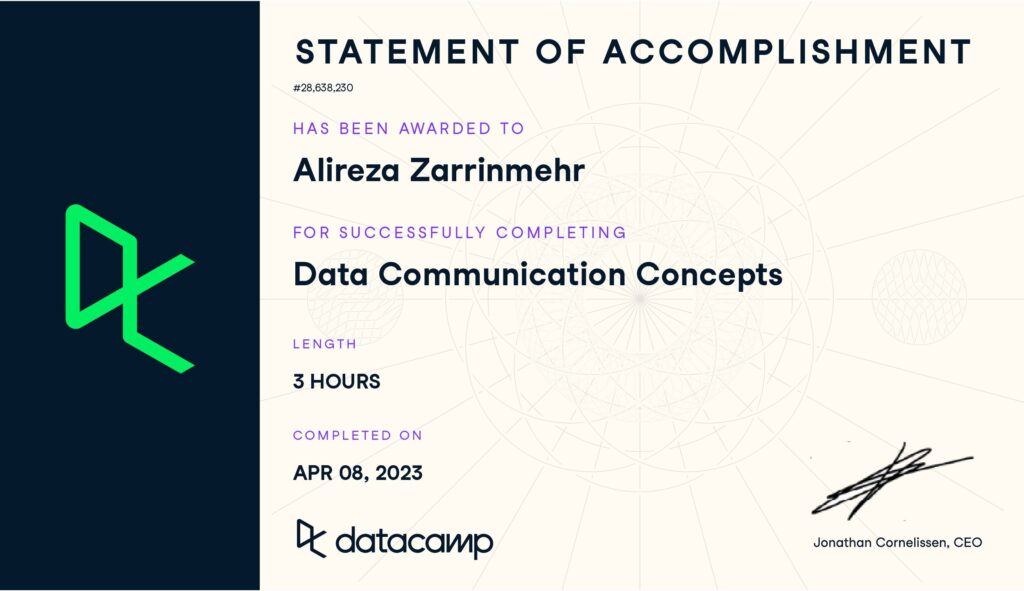
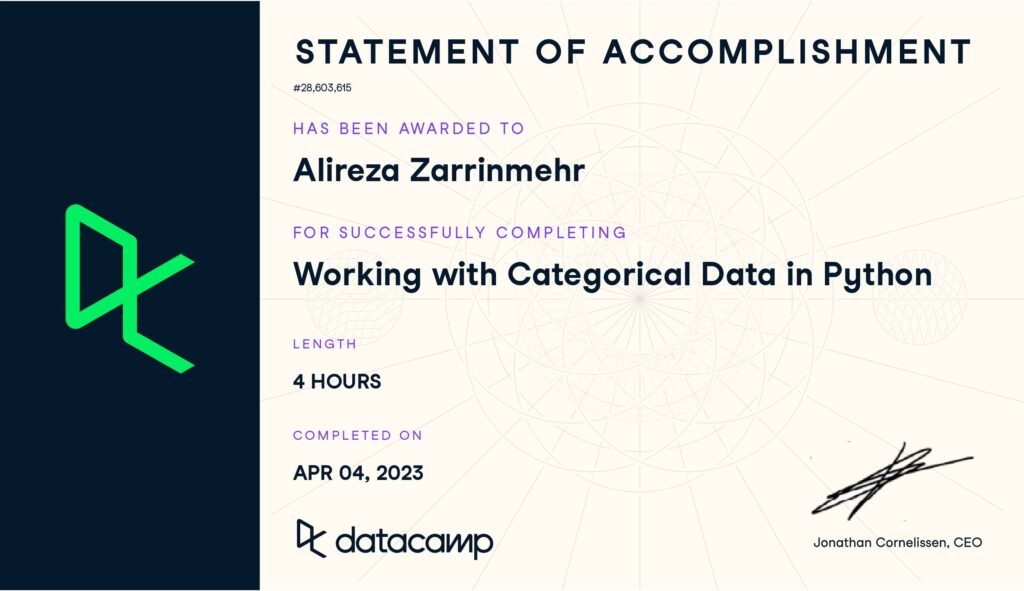
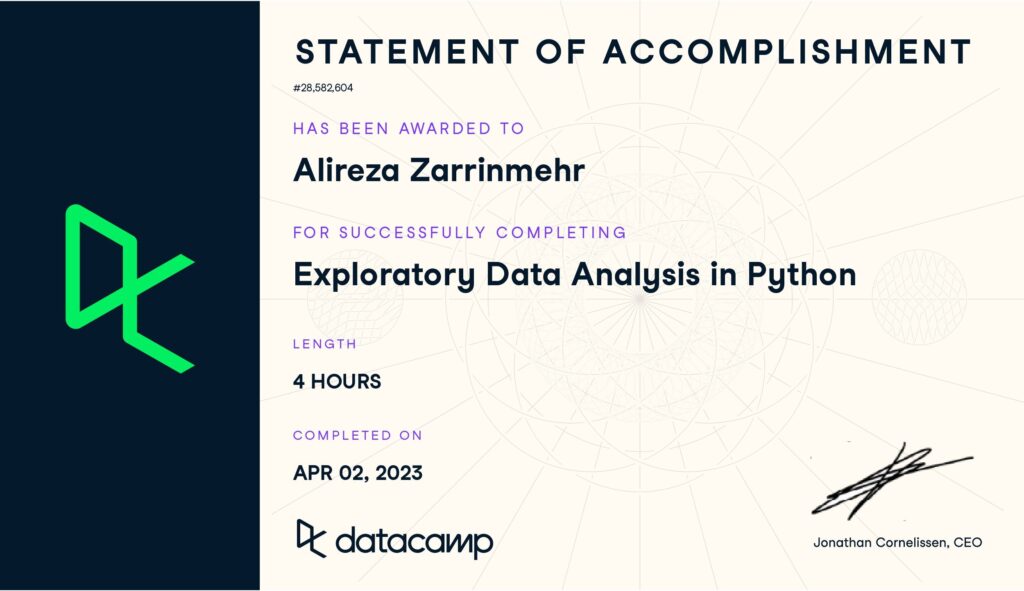
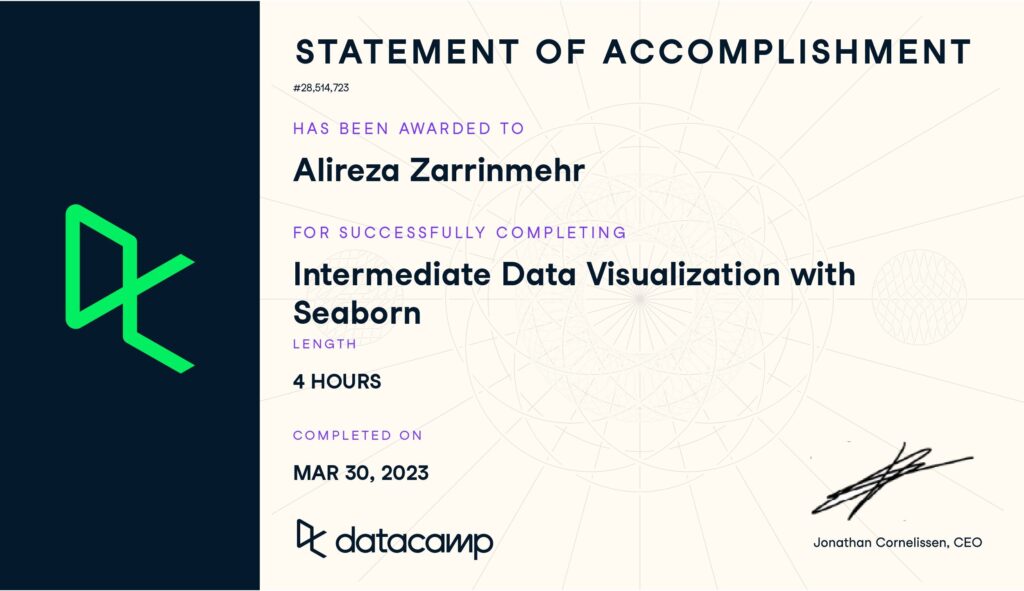
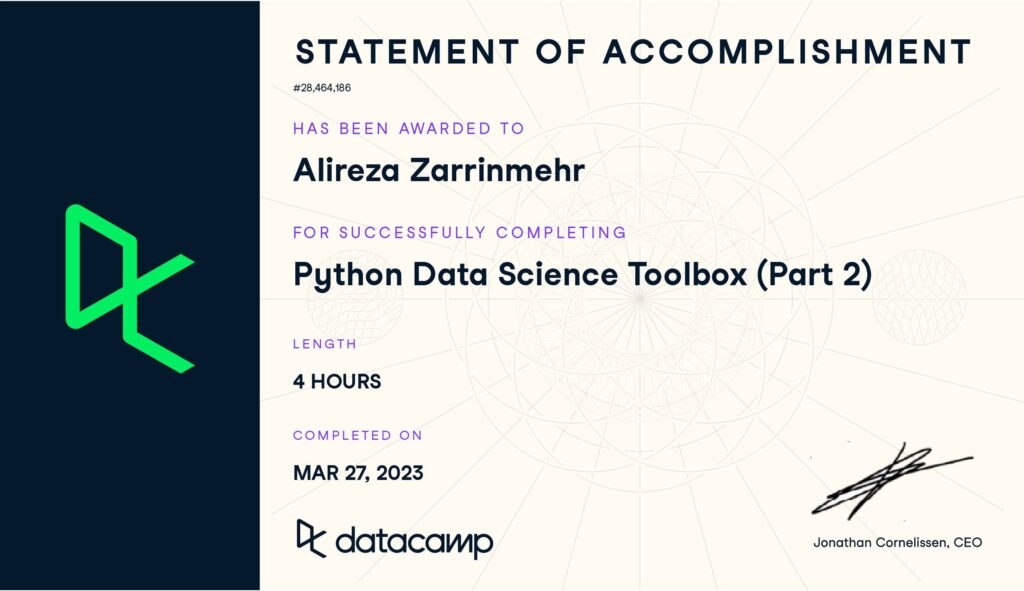
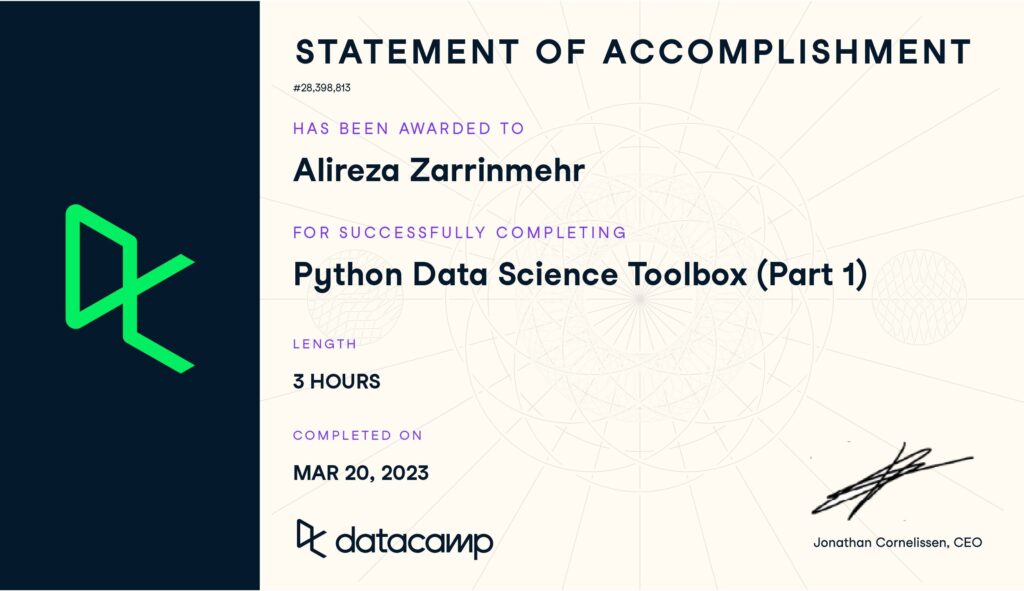
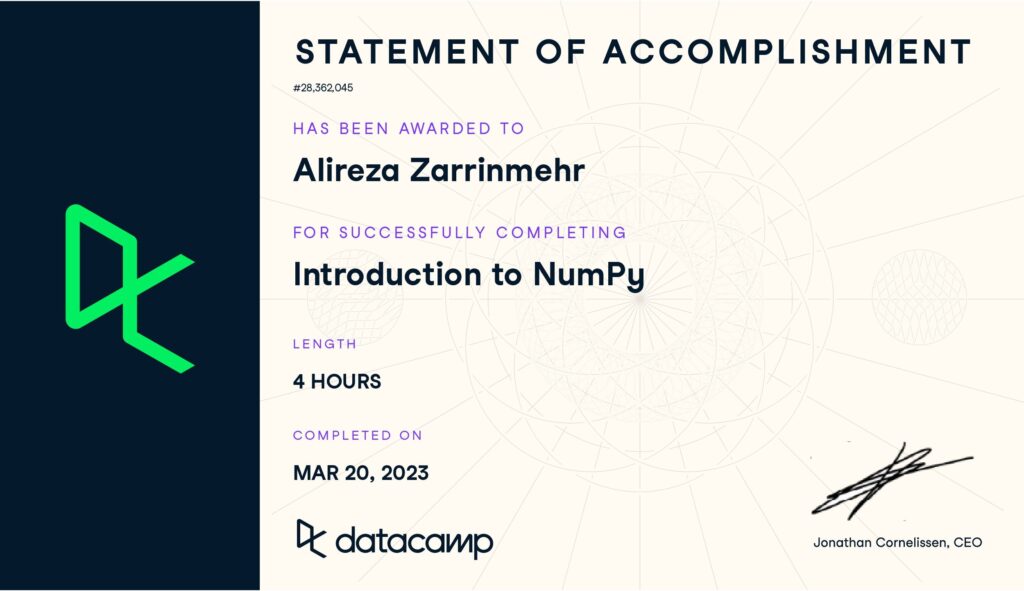
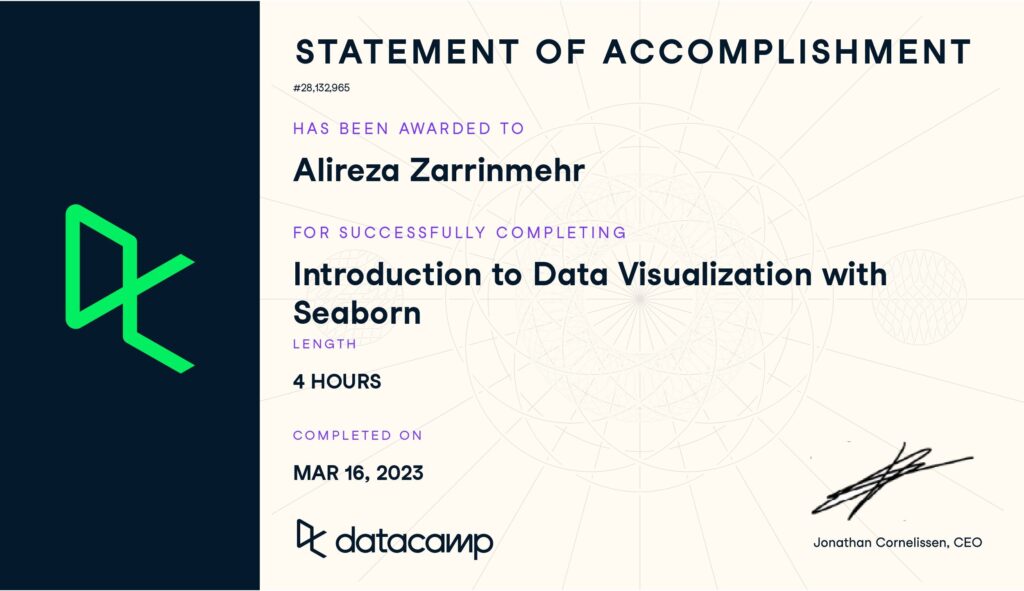
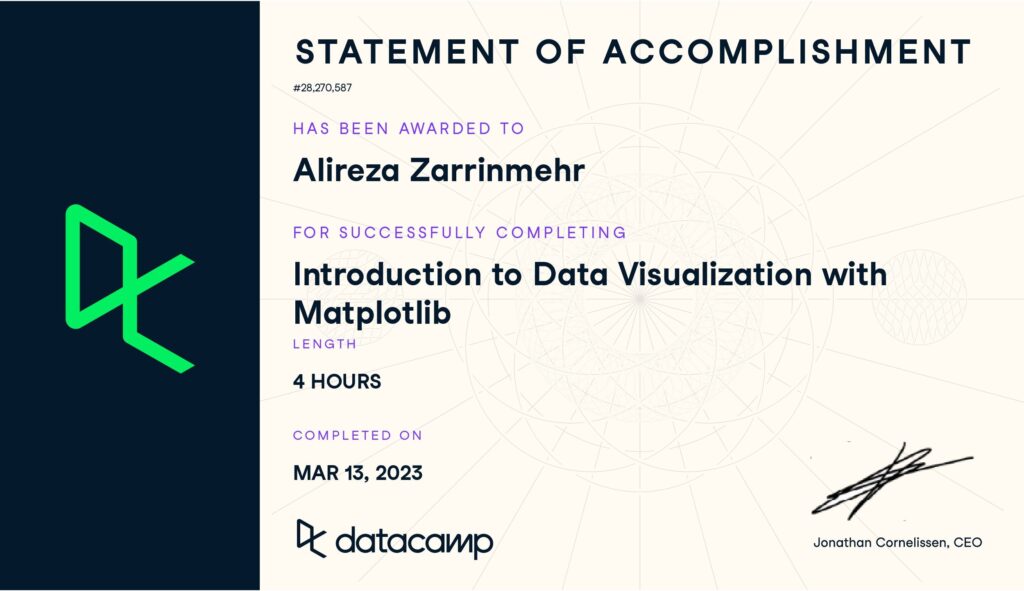
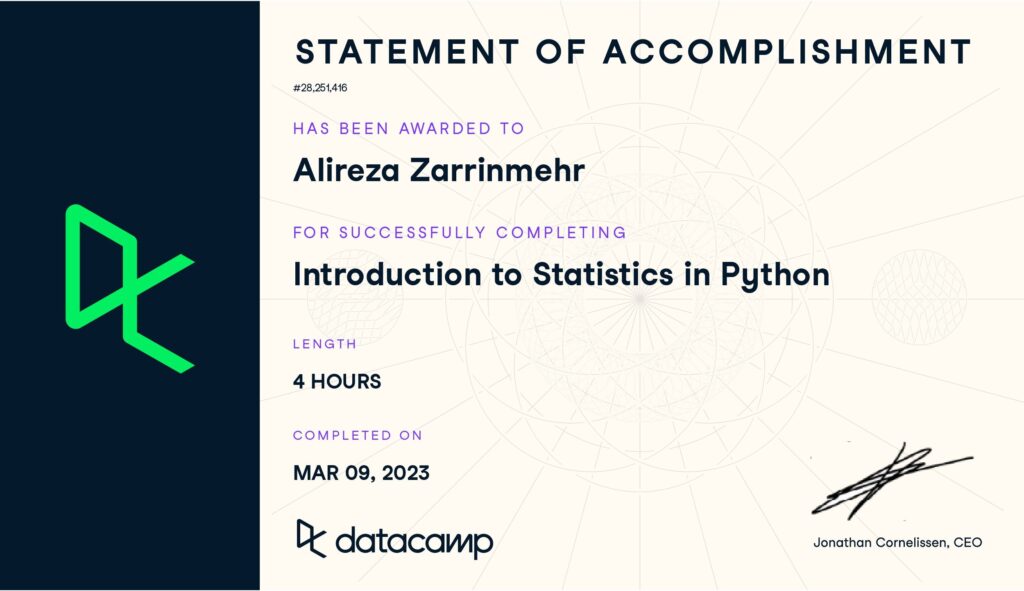
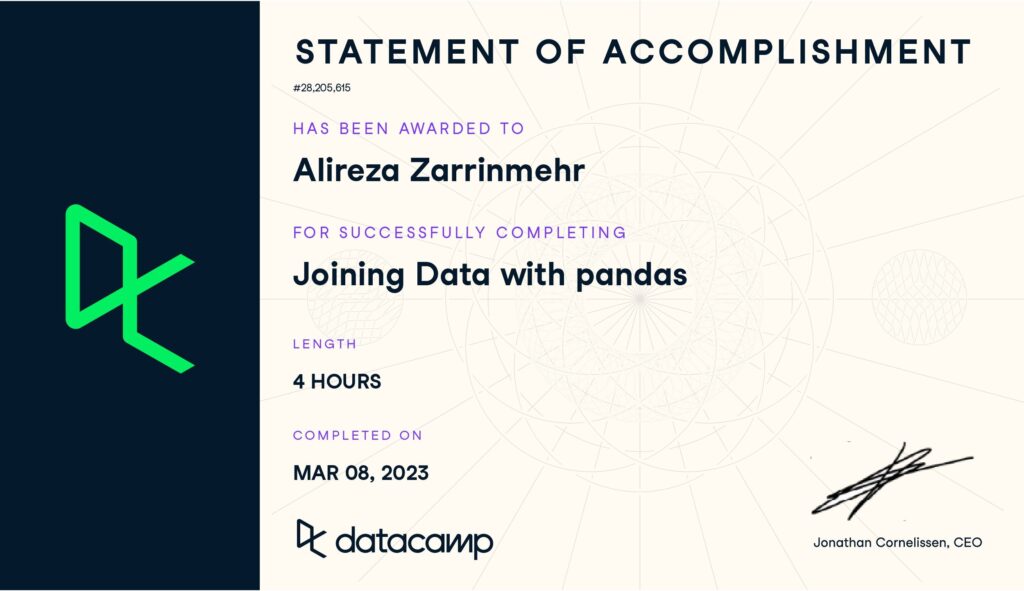
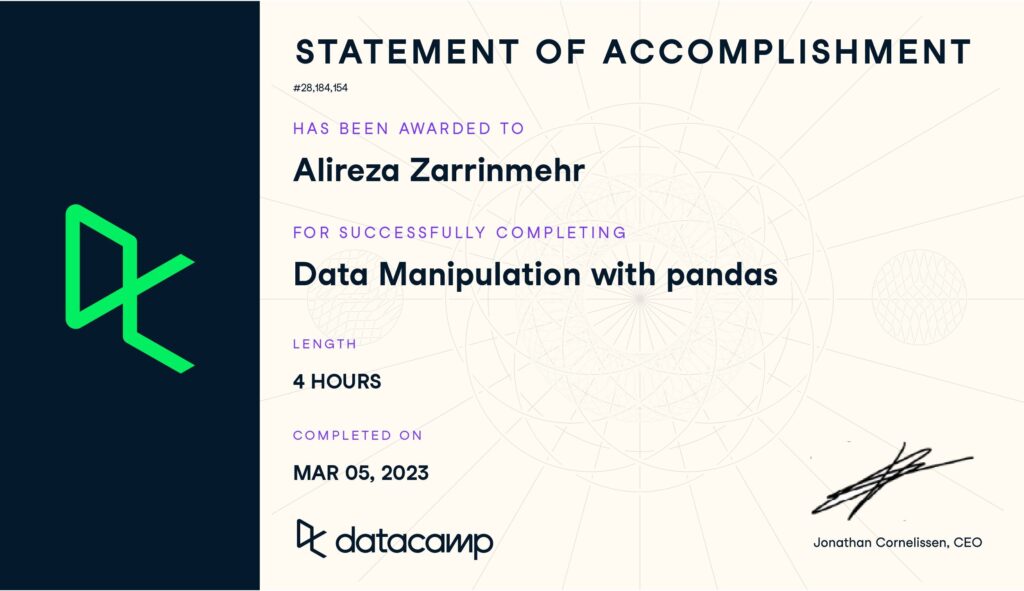
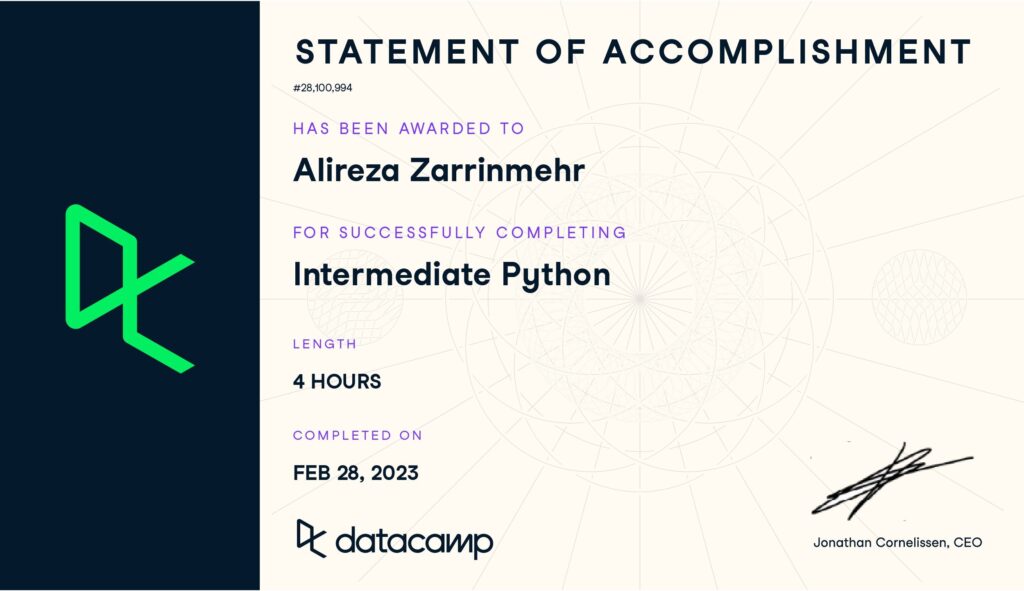
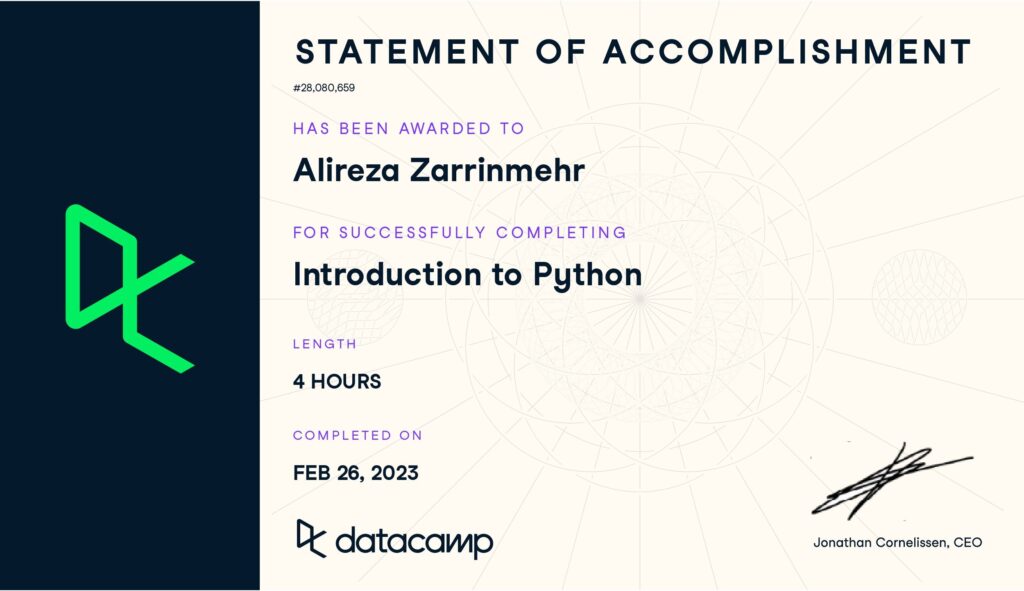
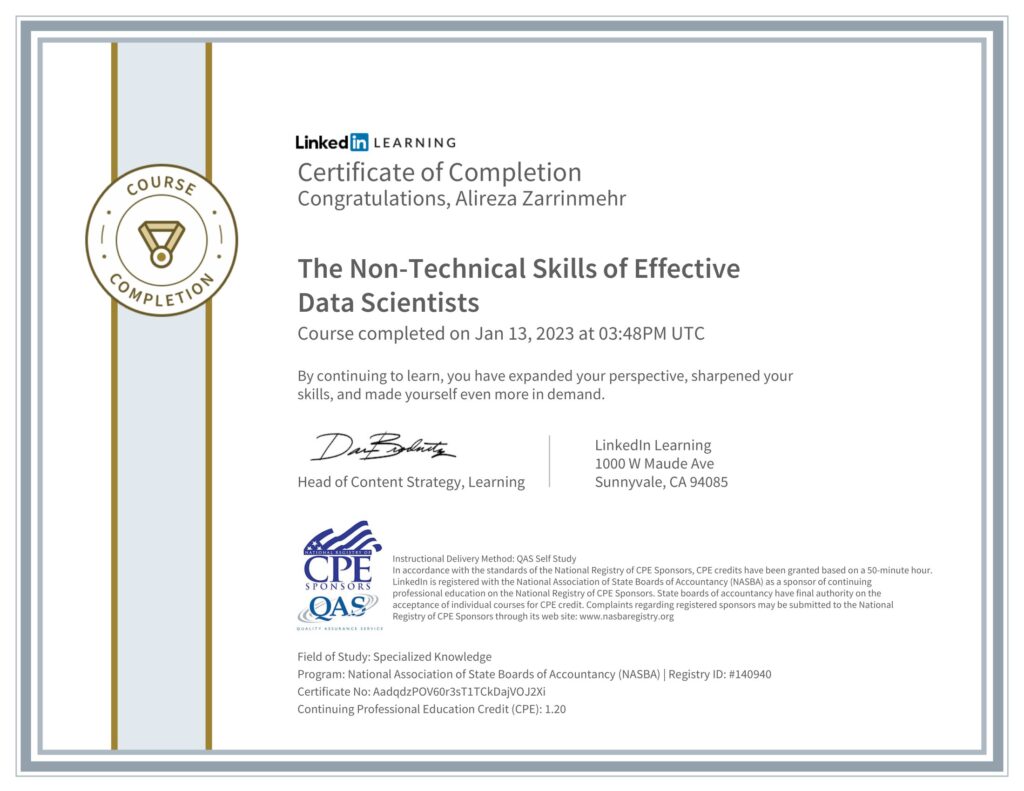
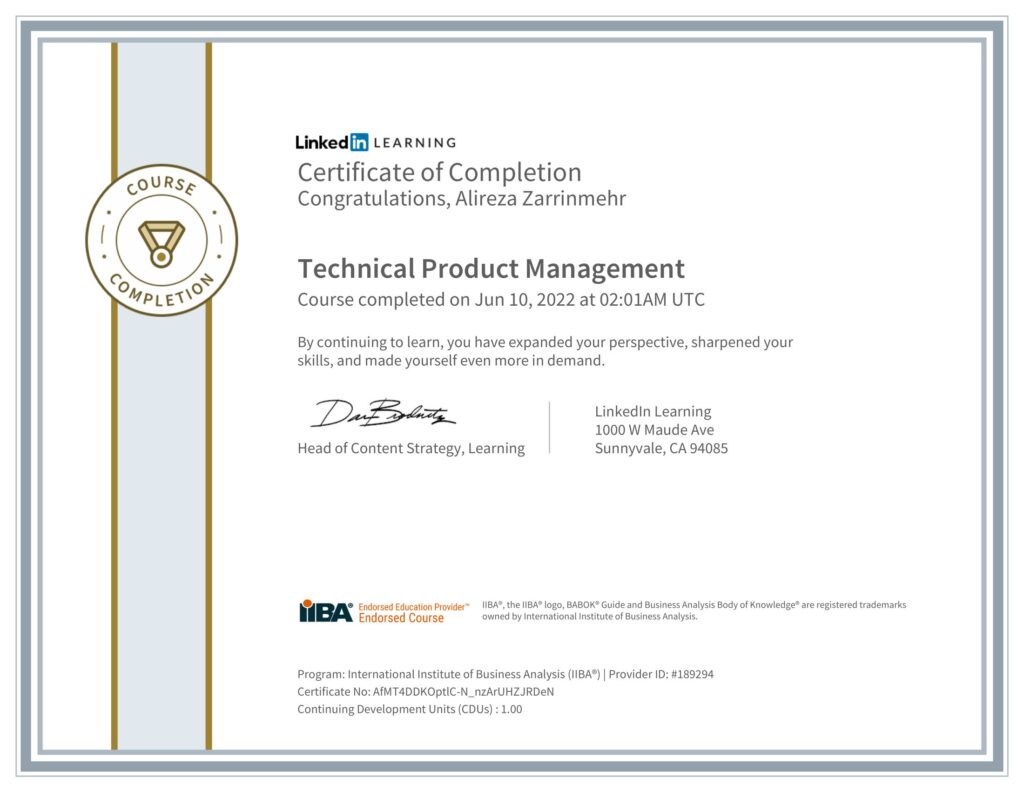
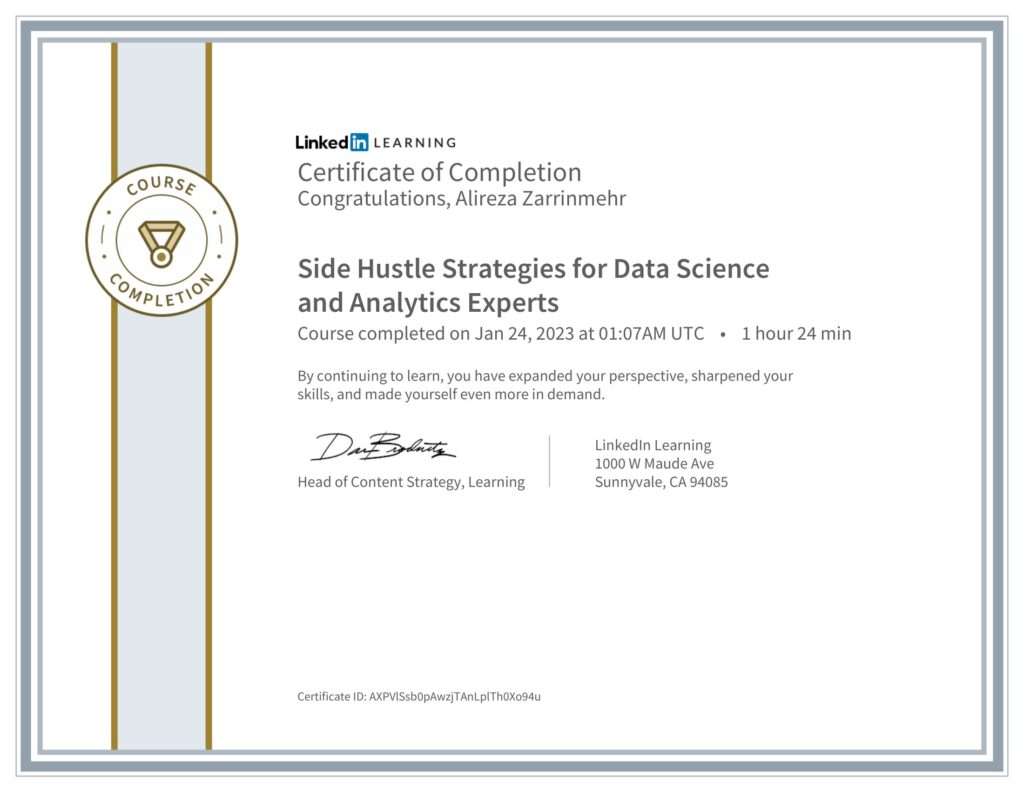
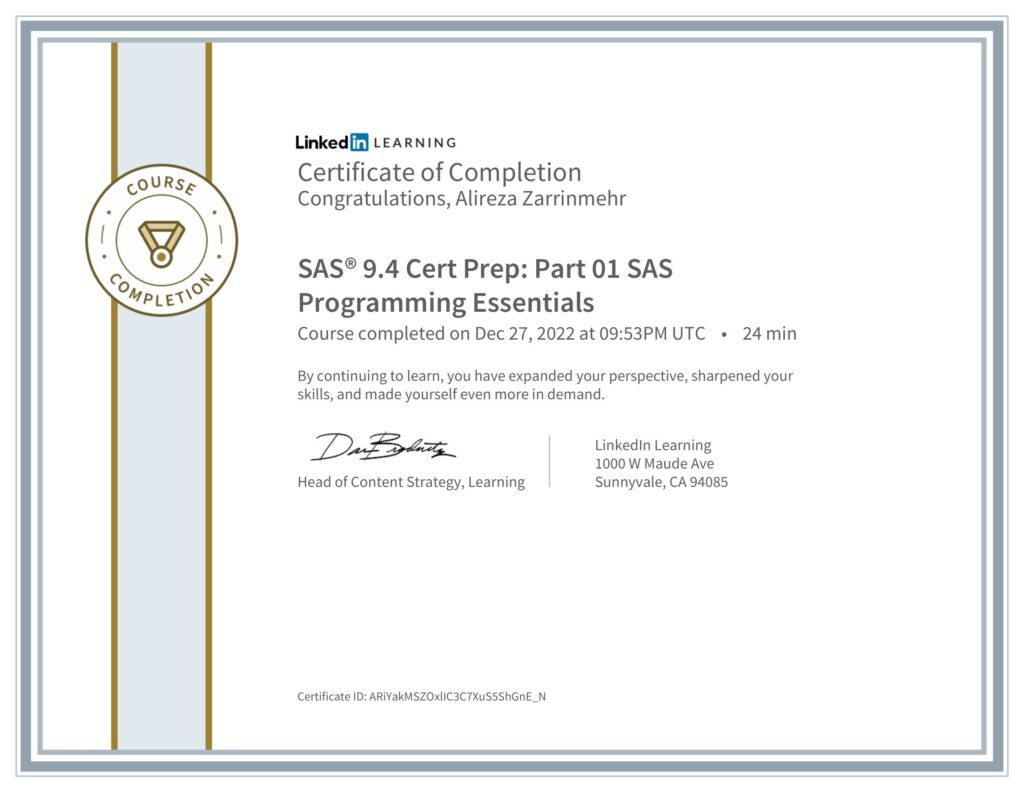
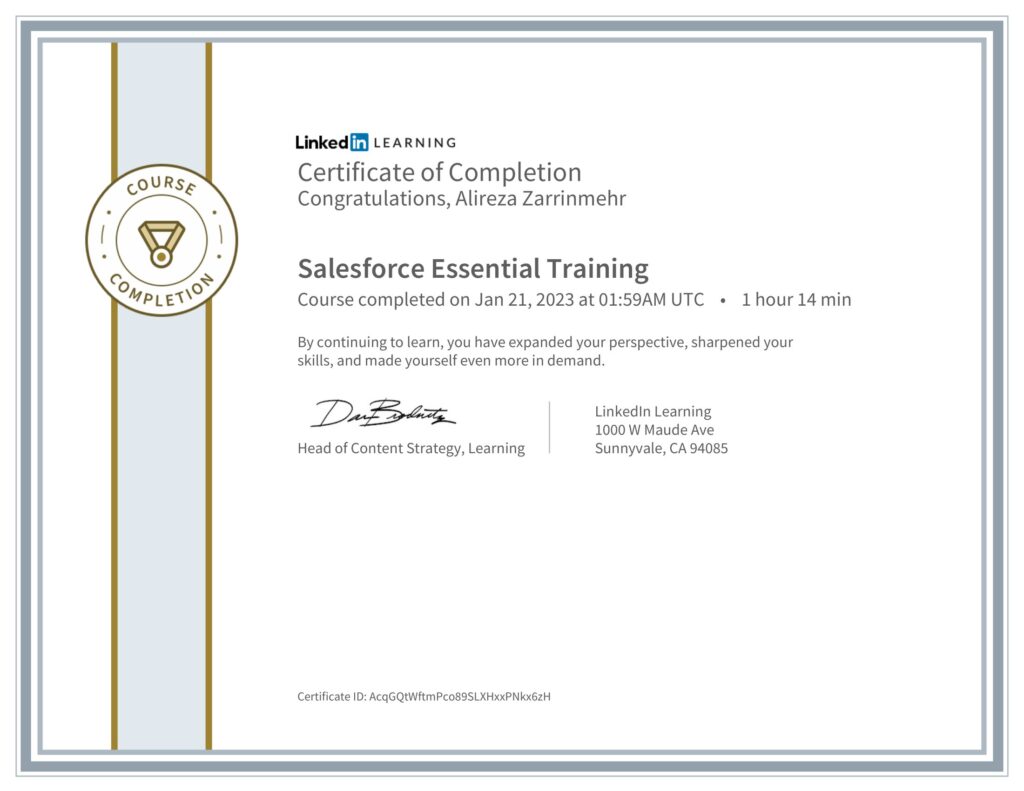
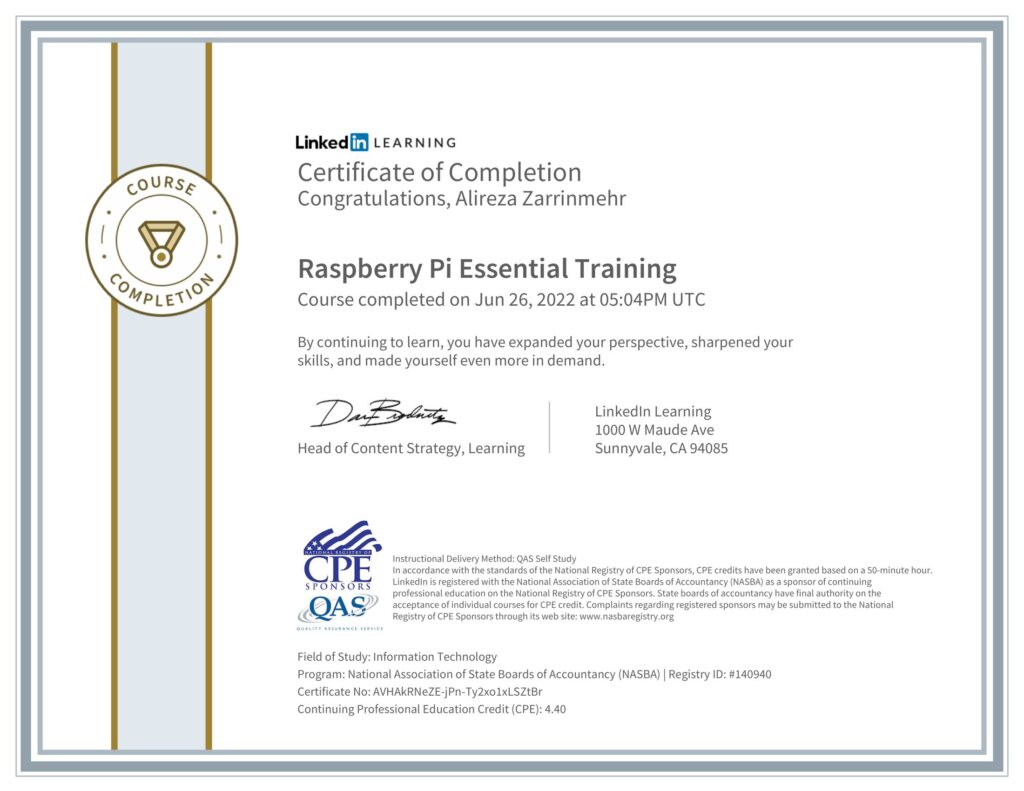
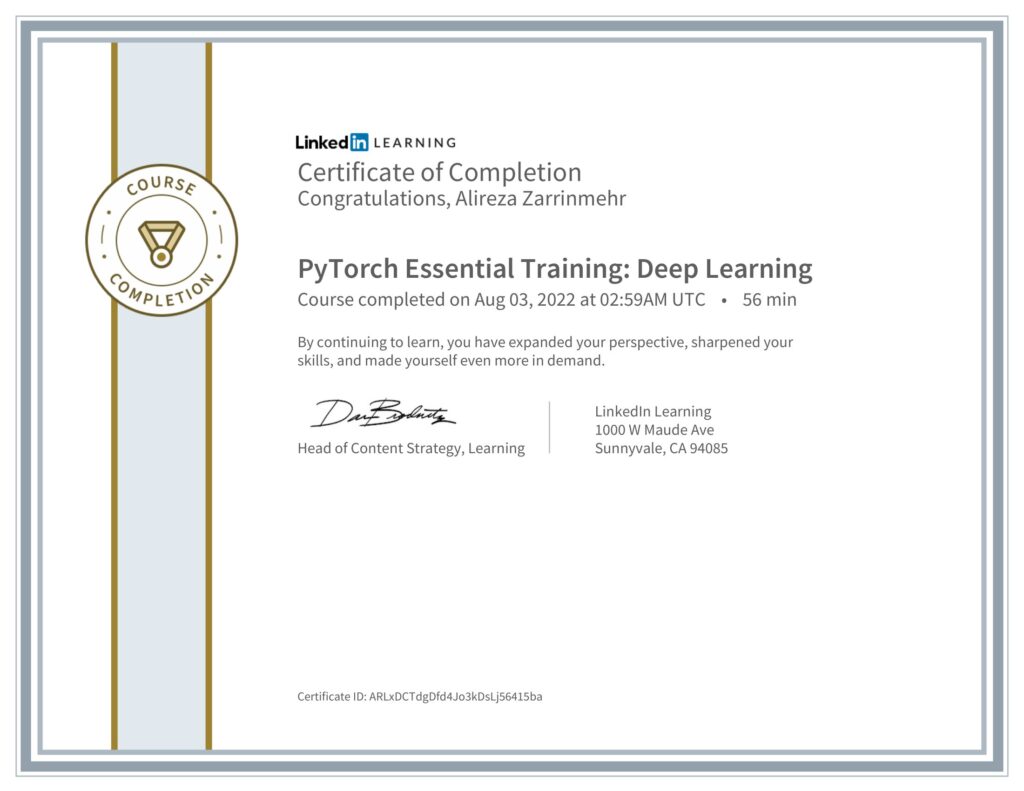
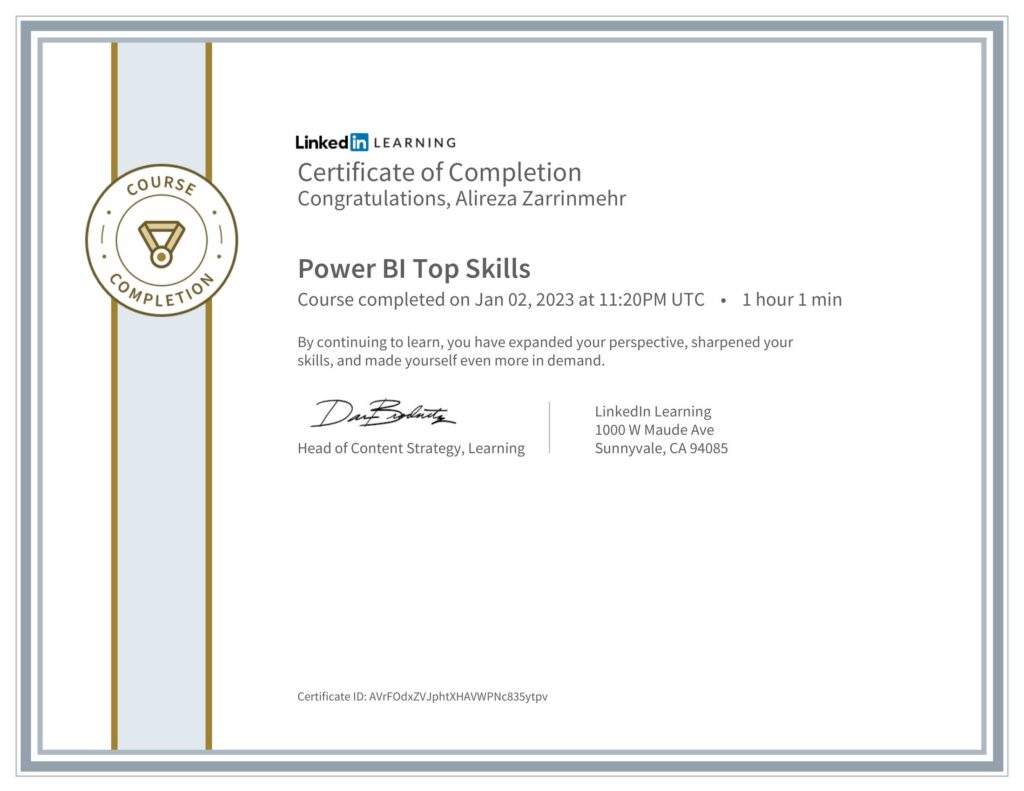
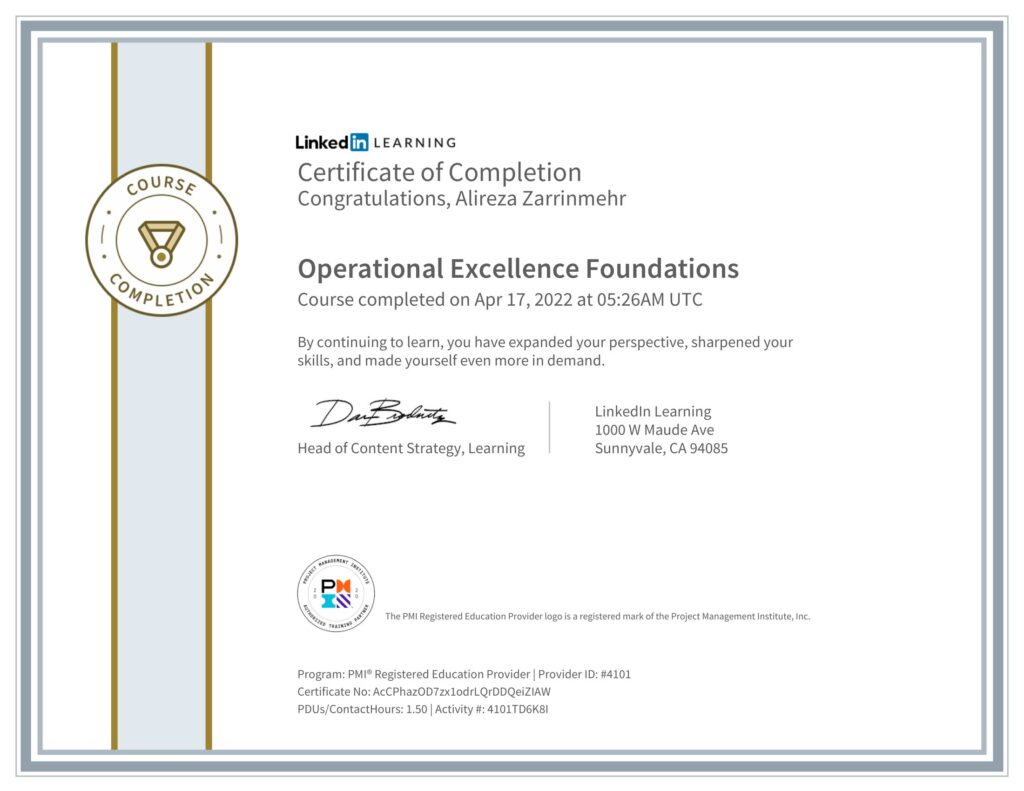
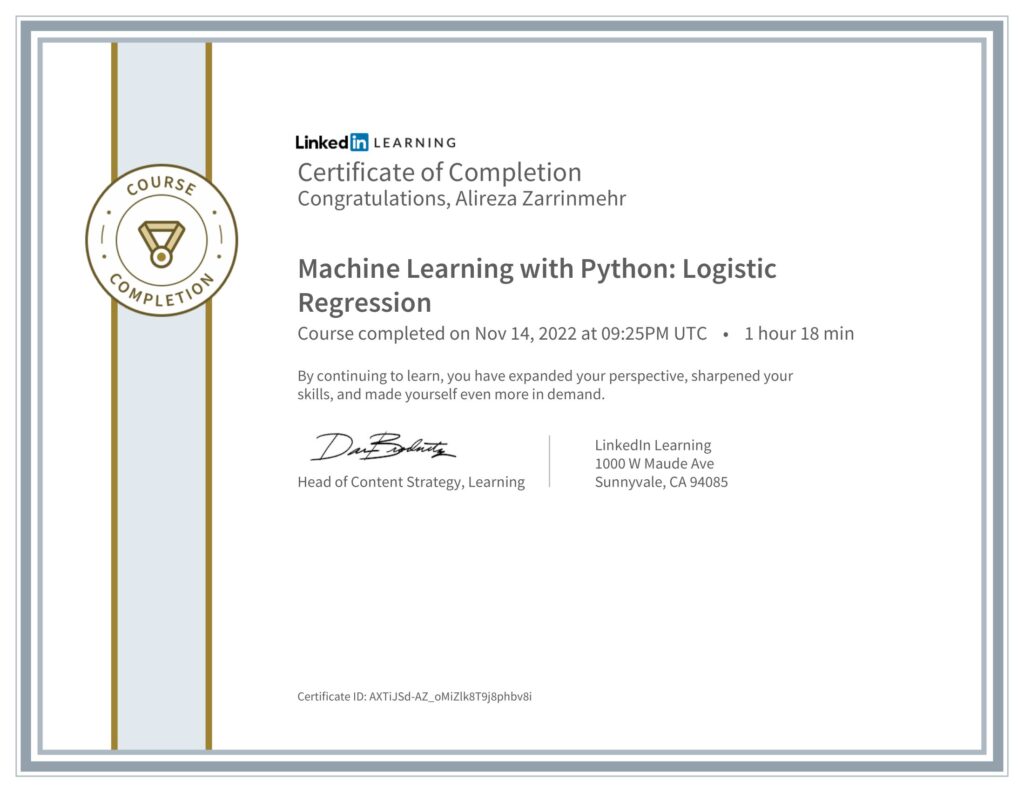
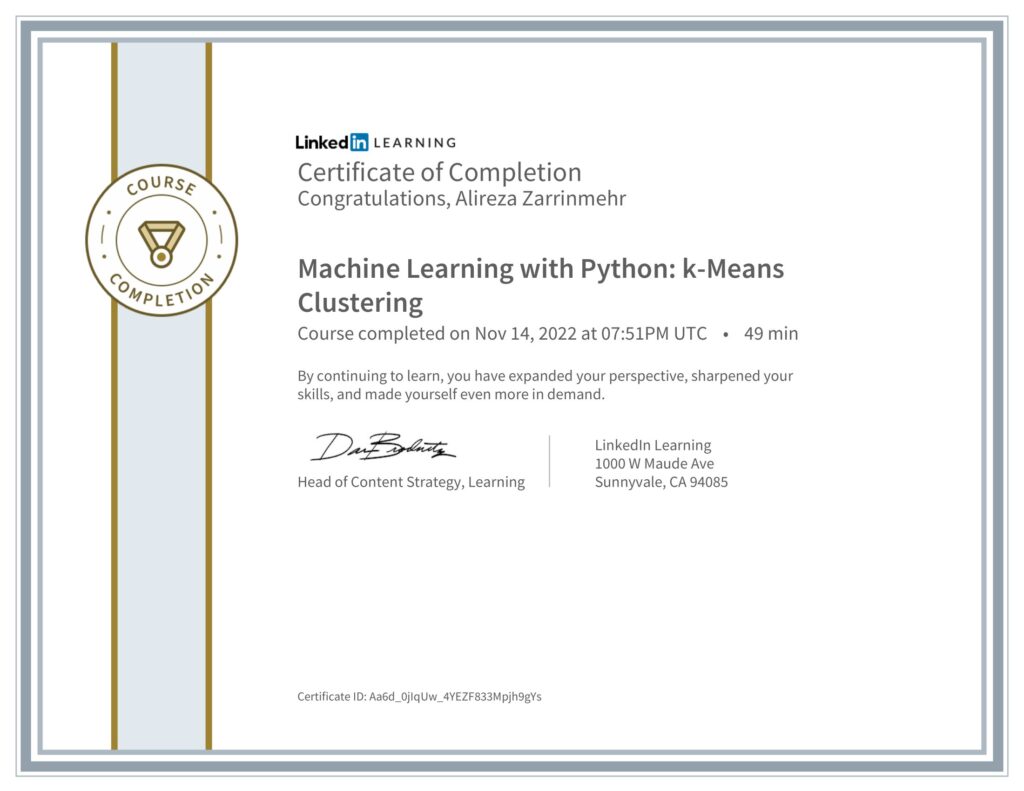
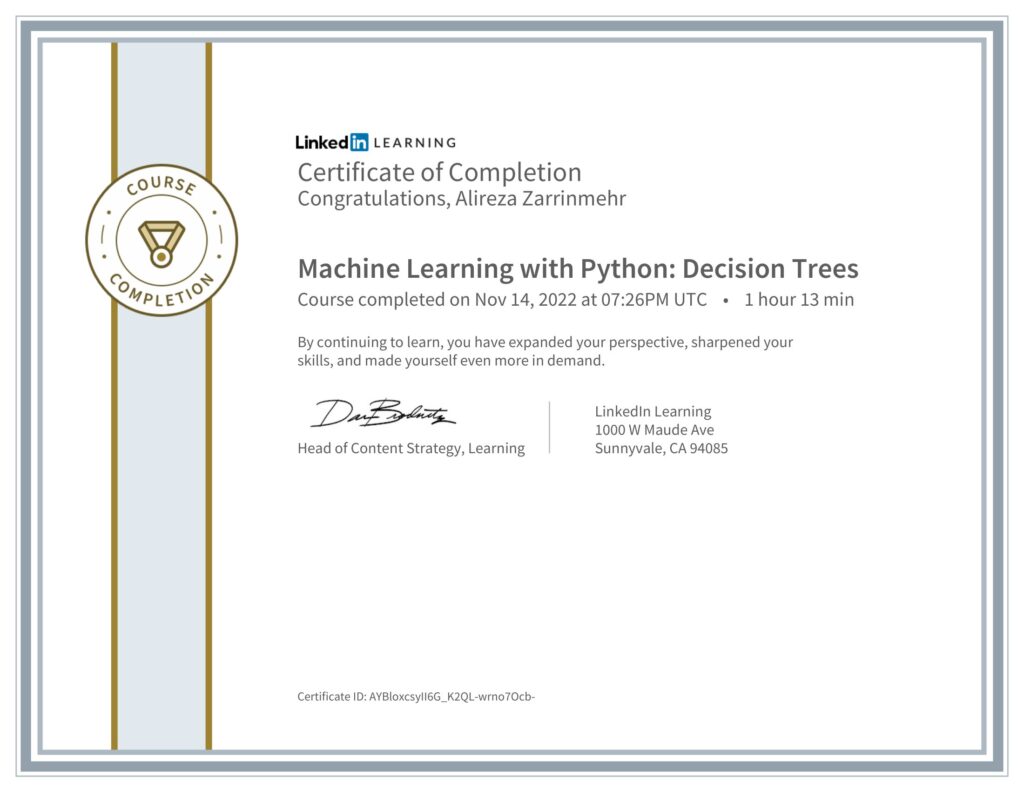
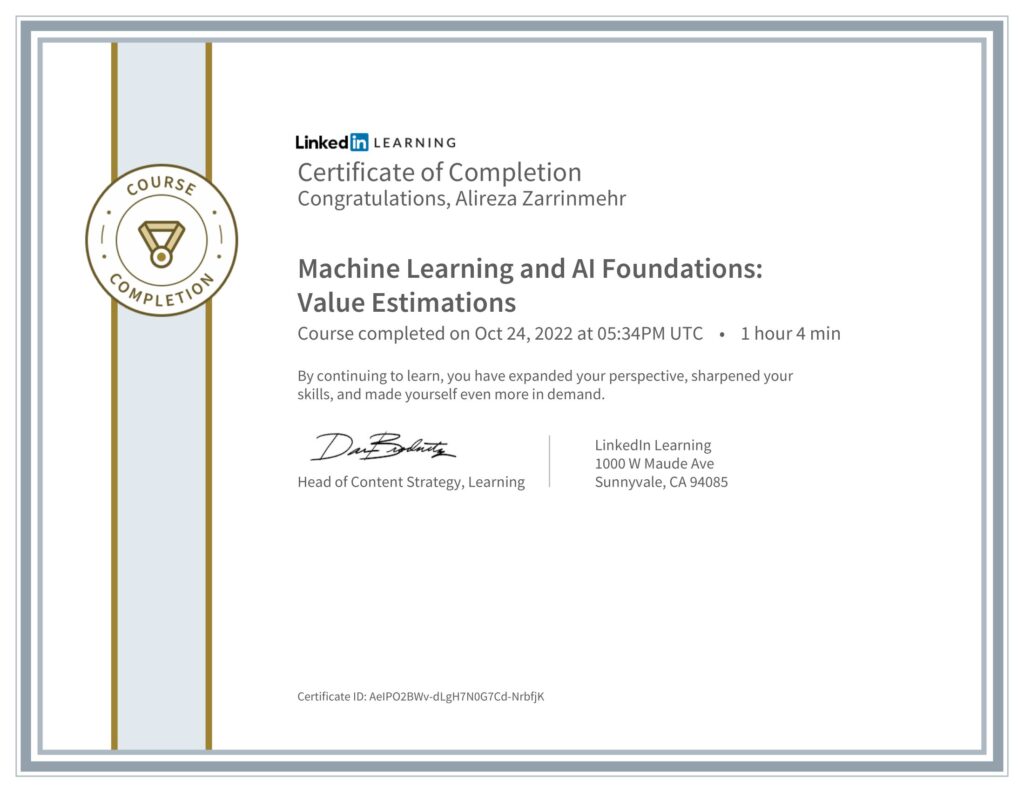
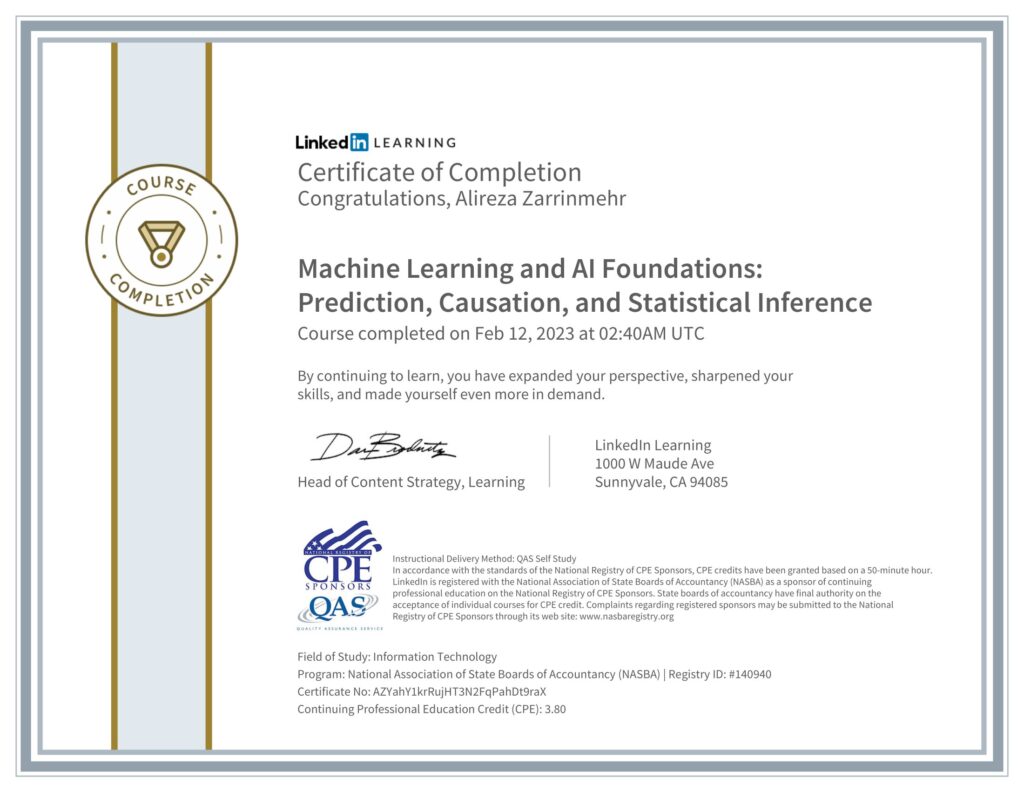
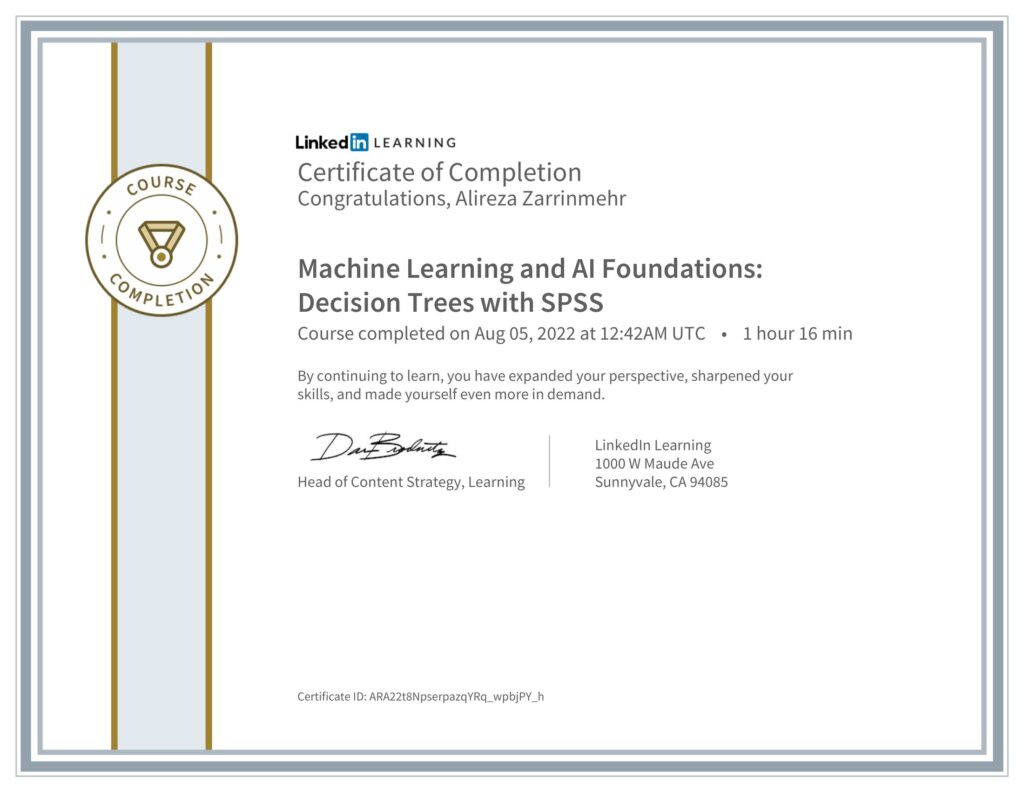
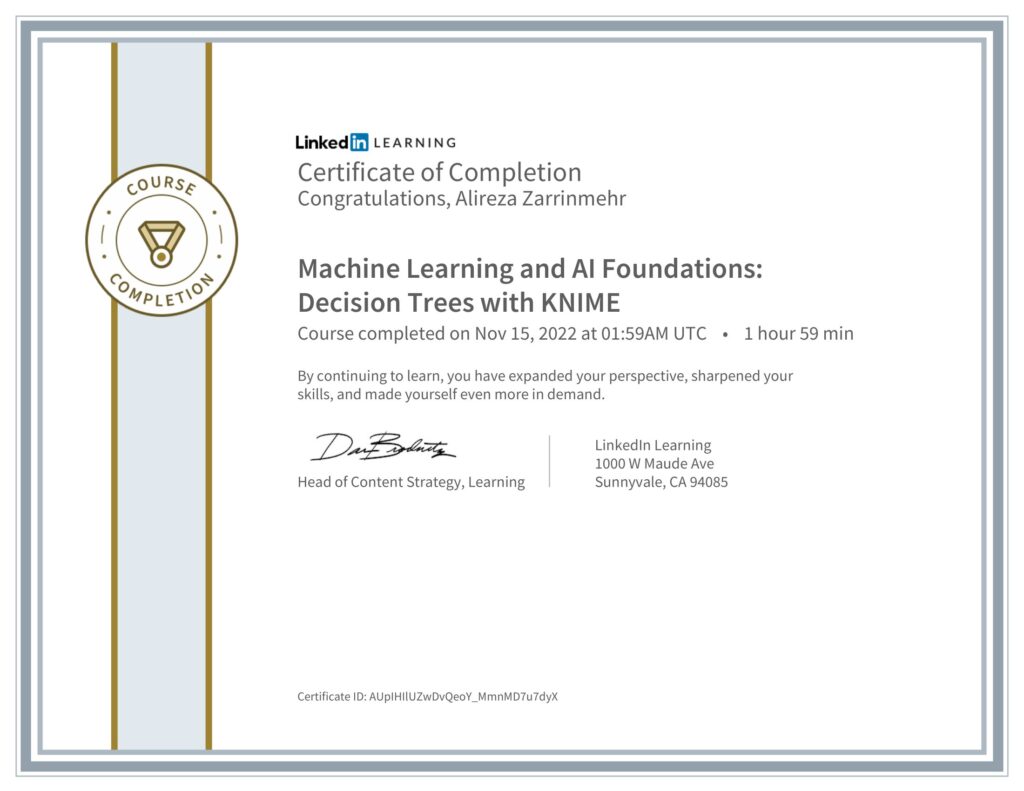
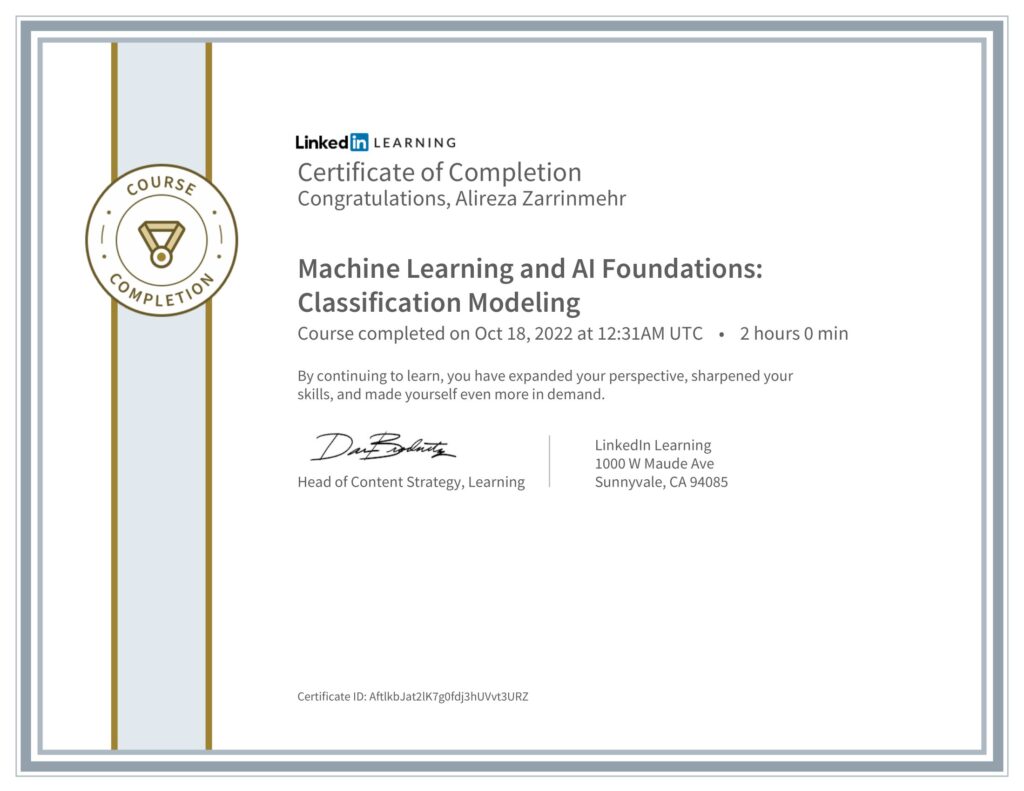
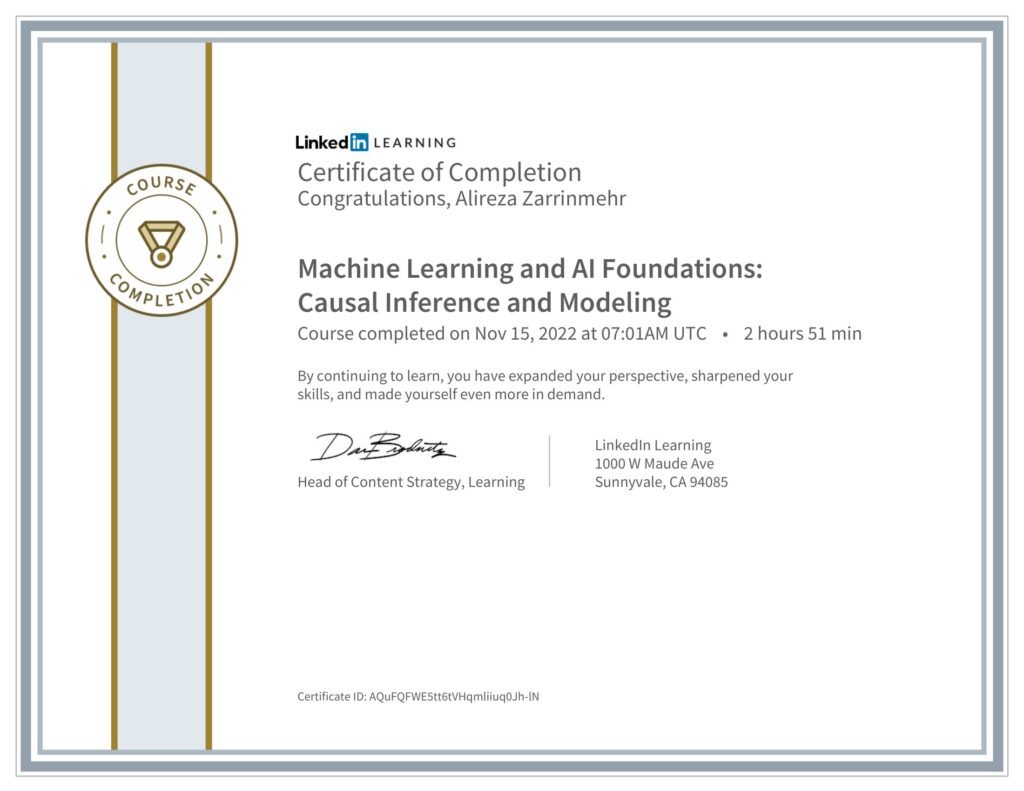
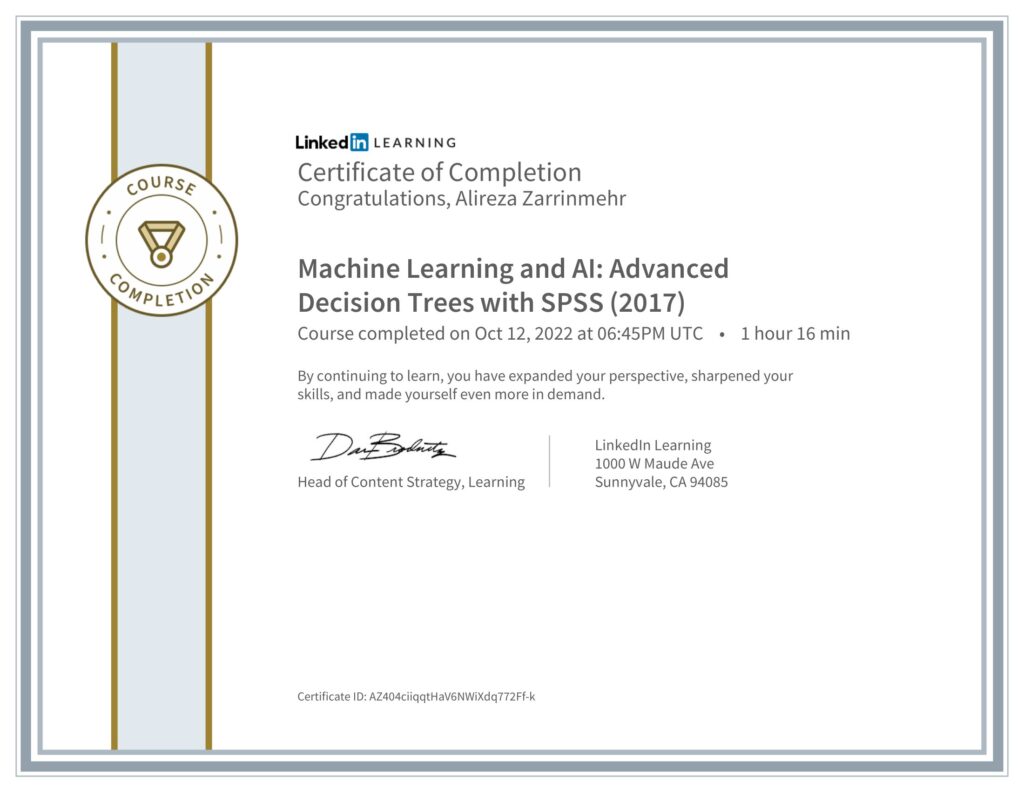
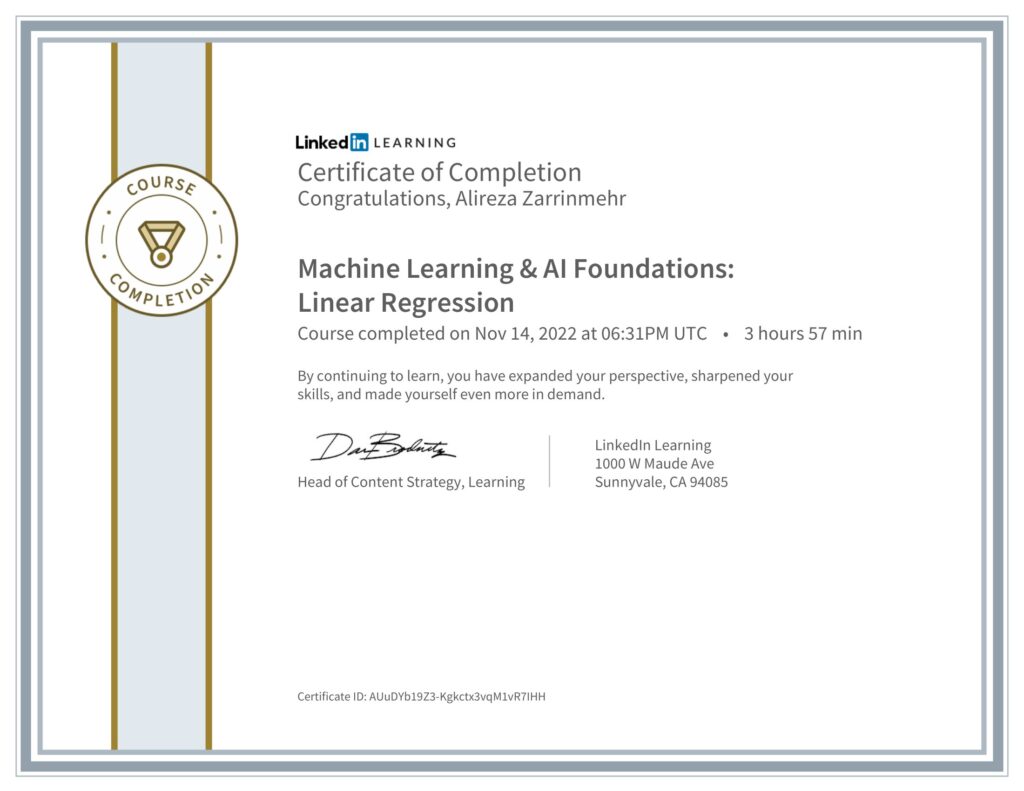
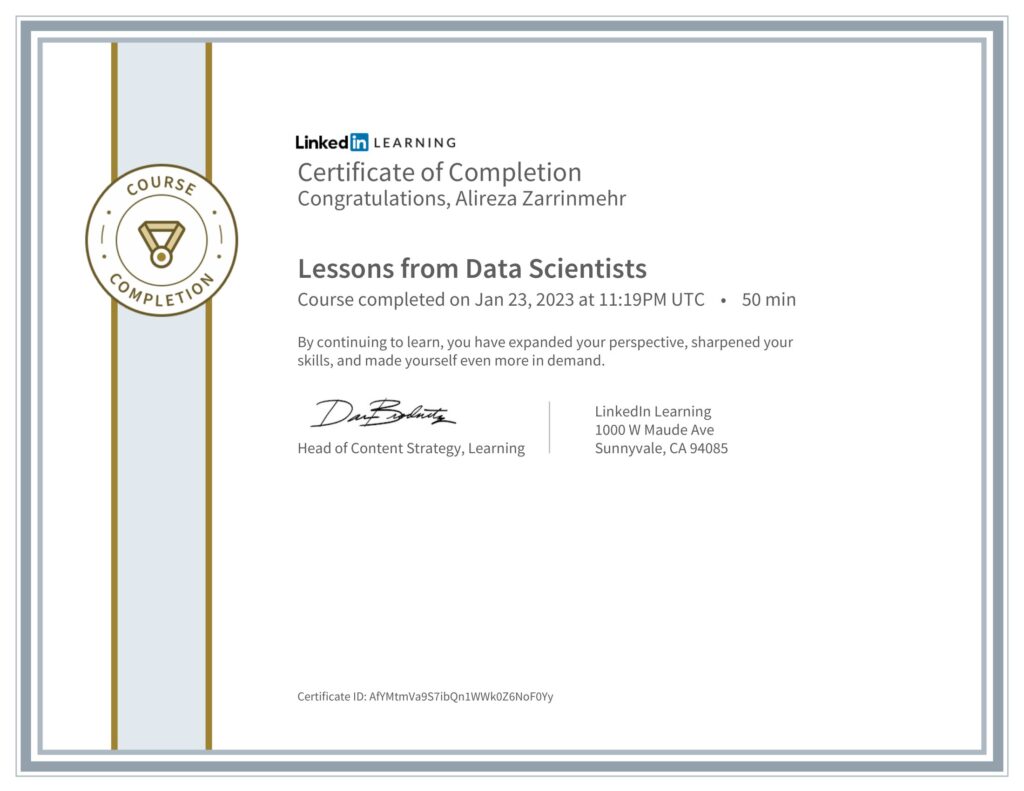
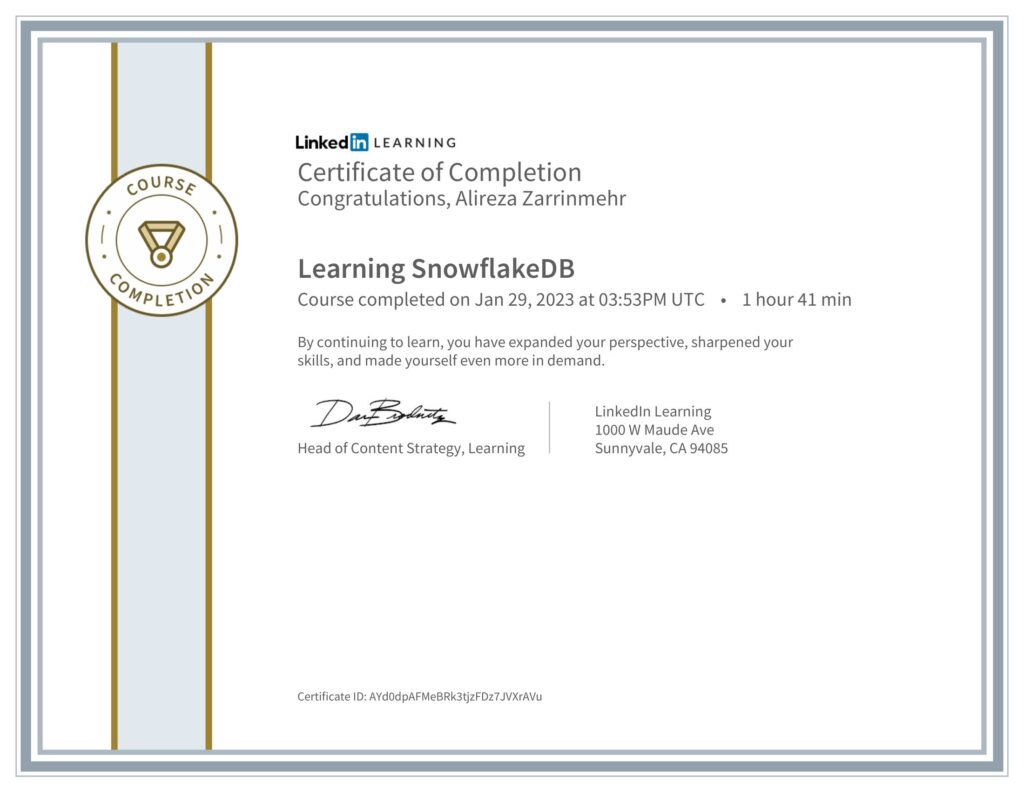
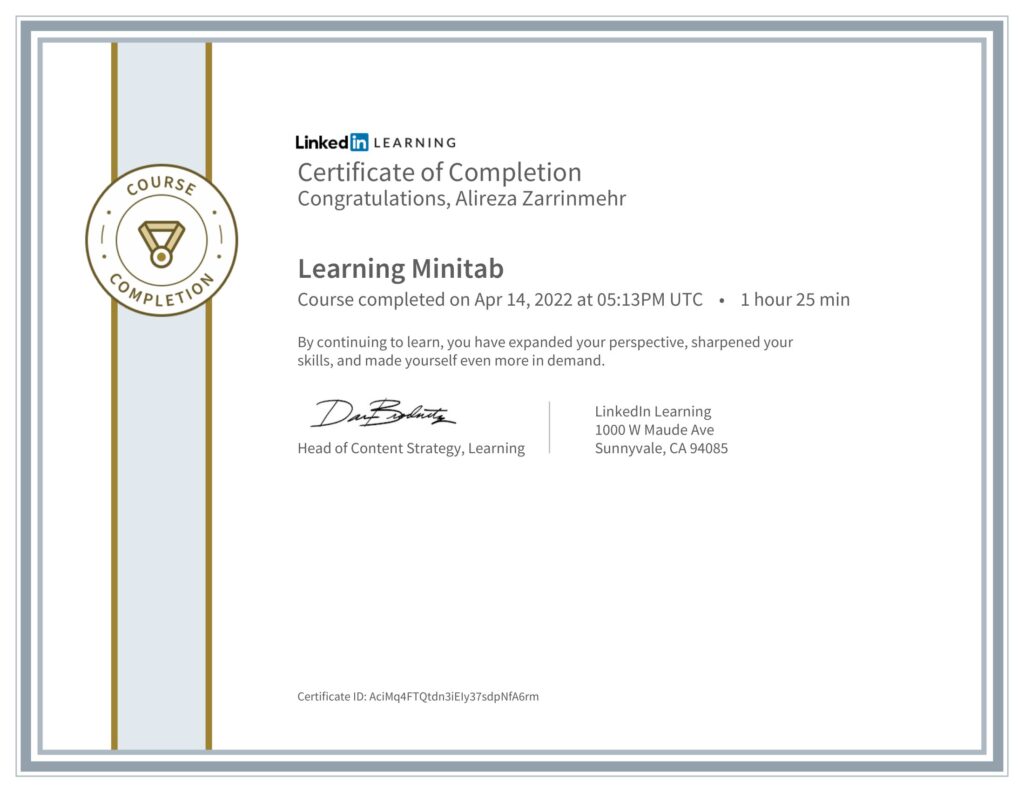
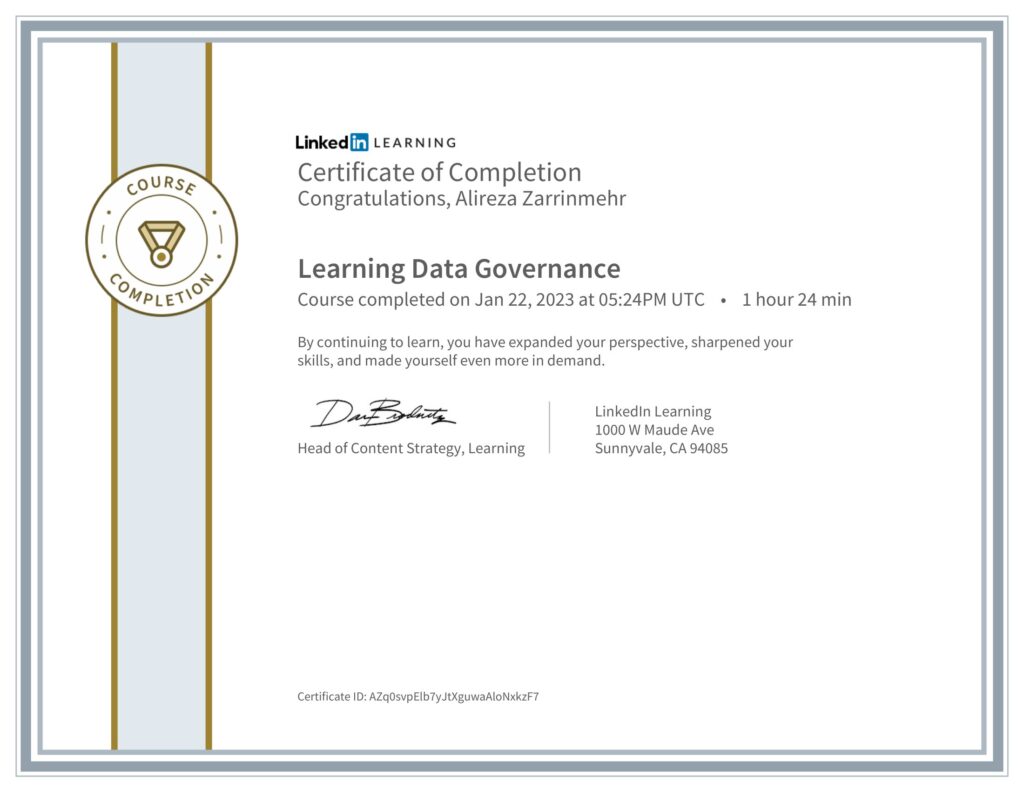
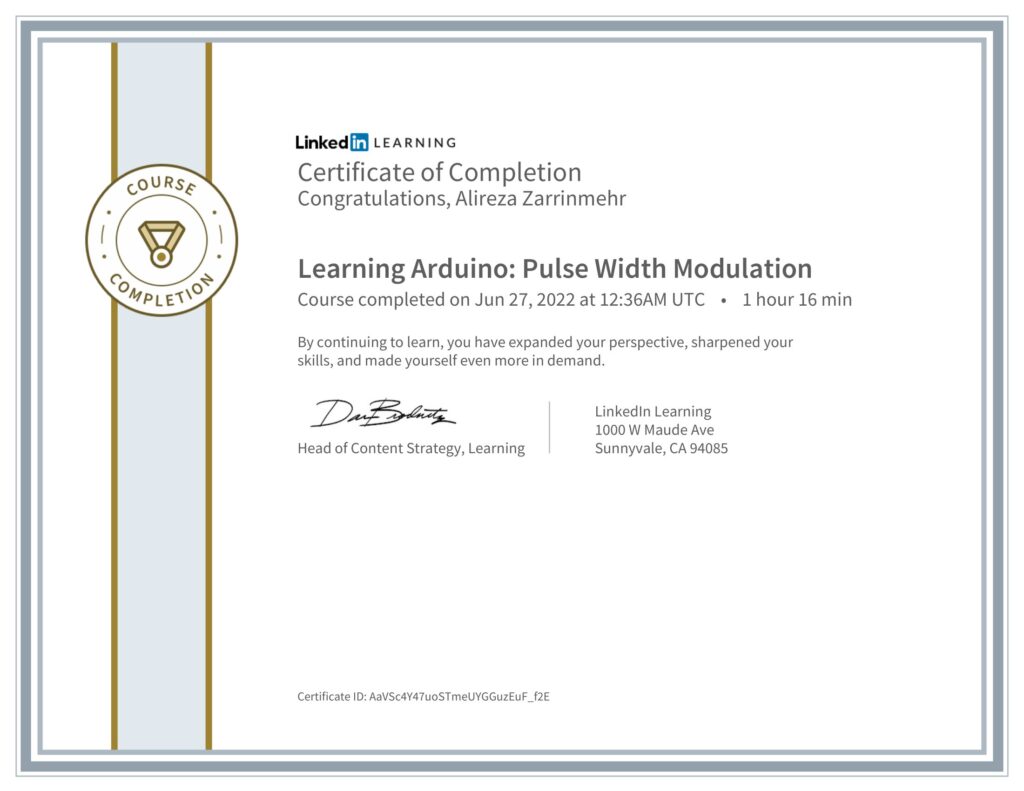
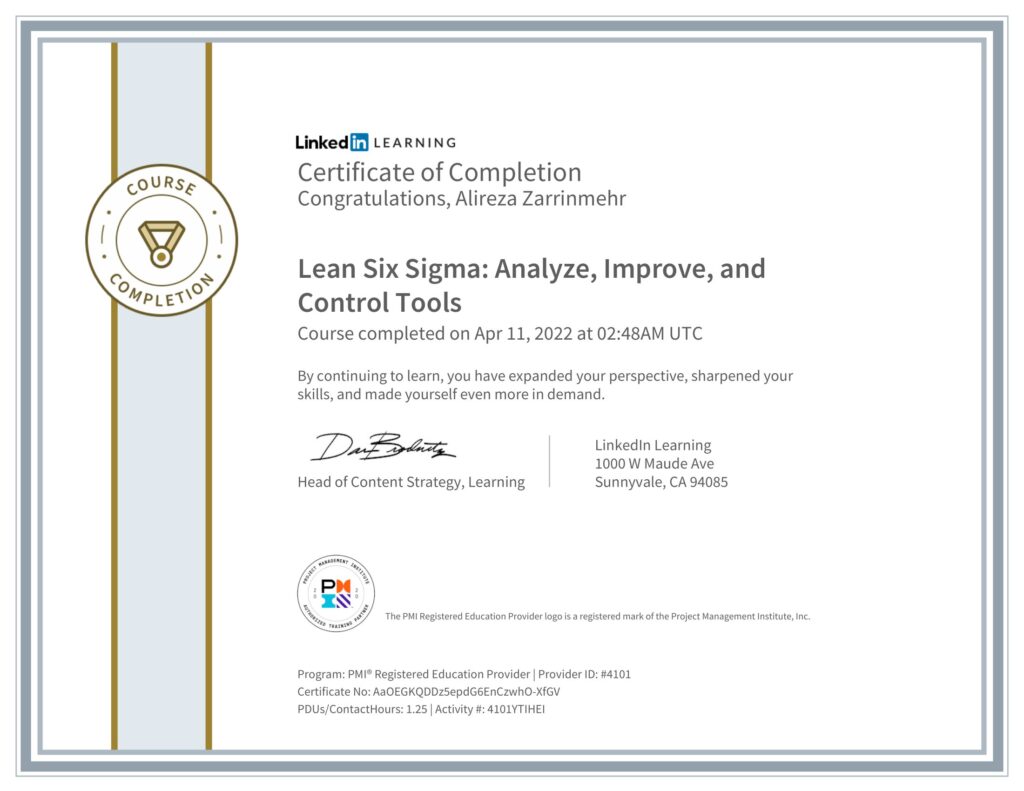
Certificates:
